⭐⭐⭐⭐⭐ Best NRP Indicators for All Markets ↩️
Submit your review | |
ℹ️ How to suitably Fan Out RSI
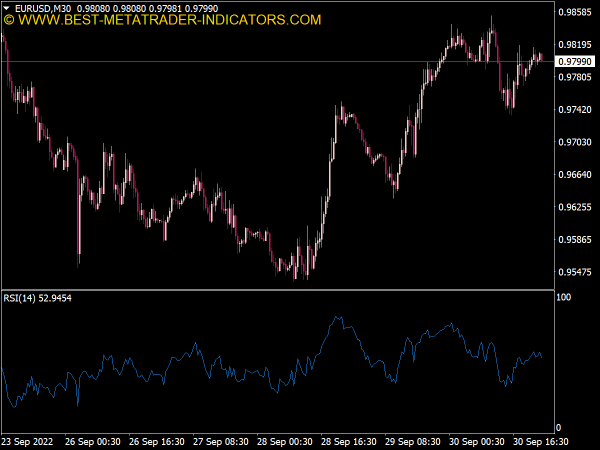
Relative Strength Index (RSI) is one of famous technical indicators used by the majority of technical analysts in the world. RSI was developed by a notable technician J. Welles Wilder and featured in his book New Concepts in Technical Trading Systems which published in 1978. RSI is a momentum indicator which calculates the speed and change of price movements and RSI fluctuates from 0 and 100.
Similar to other momentum indicators, we should always bear in mind that RSI works best during a ranging market and often fails when a market is trending. Therefore, the very first thing we should gauge before analyzing a market and fanning out RSI is assessing whether a market is trending or non-trending. When we find a market is trending, we then should avoid using RSI as an oscillator, otherwise we will have false signals from RSI even though RSI itself can be used to measure a trend.
After finding a market tends to move in sideways manner, we may explore RSI to the fullest in an attempt to analyze a market up to the best accuracy. Following are some usages of RSI that we should take a note so that we can suitably use RSI:
RSI can be used to generate buy/sell signal
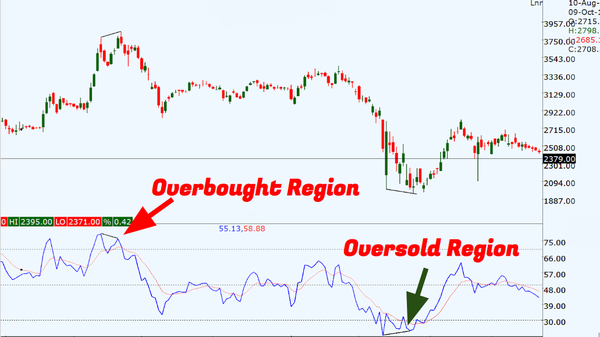
Similar to other oscillators, we can have buy and sell signals by deploying RSI. As presented in the figure 1 below, buy signal is generated when RSI moves up from 30 or from oversold zone. On the flip side, sell signal shows up when RSI moves down from 70 or from oversold zone. As we can see there, some signals also produced even RSI doesn’t touch the 30 and 70 levels or overbought/oversold zone. However, a signal that generated from a situation where RSI moves from below/above 30 and 70 or overbought/oversold can be a significant one.
Deploying RSI to determine overbought and oversold condition
When RSI moves above 70, we can say that a market is in overbought condition and when RSI falls below 30, a market is in oversold condition. Figure 1 above also explains about the overbought and oversold market.
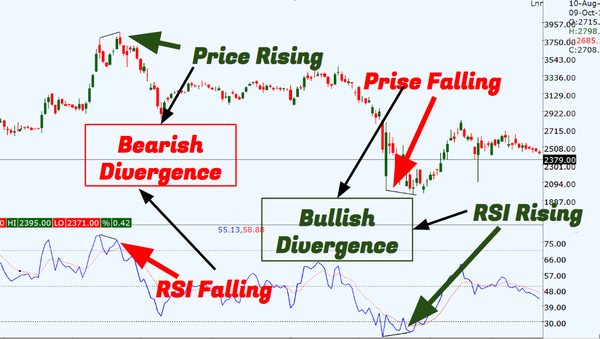
RSI can be implemented to determine bullish and bearish divergence
A divergence is an interesting concept in technical analysis as it can tell us a possibility of a market’s turning point after performing a trend.
However, we should keep in mind that divergence concept can send false signals during a strong trend. Therefore, we need to be more careful and never try to pick a top or a bottom when a powerful trend clearly appears in a market until more reliable indications appear.
There are surely more usages of RSI and we will discuss about them in the upcoming trading tips. Just keep on visiting Best-MetaTrader-Indicators.com where we all can learn together on technical analysis. See you later!
I was just about to modify the RSI indicator code to allow for variable limits and period read from global variables set in the expert, when I found your RSI Divergence indicator. Can I get the source MT4 code for this? No offense, but I'm not going to just run any executable when I don't know what's in it.
Please, i need a custom RSI indicator with laptop and android push notification alerts on 50 crossover, the crossover at 50 will work with 2 MAs for further confirmation before the alert is triggered. i will also prefer it has virtual chart dashboard.
I look forward to hearing from you on further requirements for this.
Thanks.
More Great MetaTrader Indicators 📌
- Most Popular MT4 Indicators

- New MT5 Indicators Collection
- TOP 10 Best Forex MT4…

- Currency Slope Strength Indicator

- Internal Bar Strength Indicator

- Trend Strength Trading Indicator

- Relative Momentum Index MTF (RMI)
")
- Advanced Currency Strength…

- Candle Strength Indicator

- Relative Strength Levy Indicator

- Relative Vigor Index Indicator

- Adaptive Relative Strength…

- Forex Strength Meter MTF Indicator

- JPY Strength Index

- RSI Currency Strength Oscillator

- Absolute Strength Histogram…

- Oracle Strength Indicator

- Trend Strength Indicator…

- Trend Strength Indicator (MQL4)
")
- Moving Average Strength

- CHF Strength Index

- Brooky Strength Effect Indicator

- Relative Vigor Index (RVI)…
 Indicator")
- Best Trading Systems for MT4 and MT5