Submit your review | |
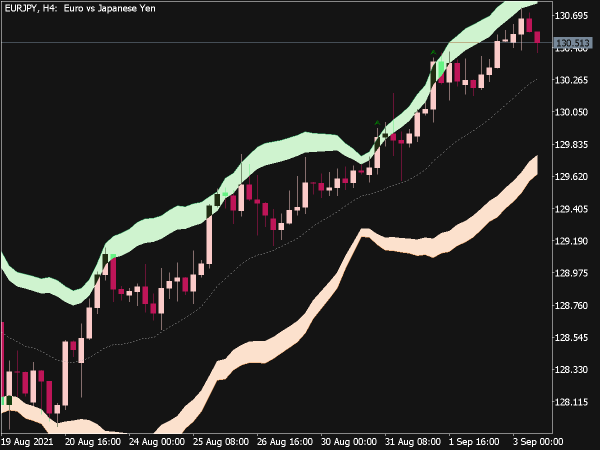
Bollinger Bands is a very useful technical analysis tool developed by John Bollinger in 1980s. The purpose of Bollinger Bands is to provide a relative definition of high and low. Bollinger Bands consist of a center line (a simple moving average) and two price bands above and below of the center line, these bands will expand when the price of an asset or a market instrument becomes volatile and contract when the pair trades in a tight range.
These price channels are the standard deviations of the moving average (the middle band), now this standard deviation is a mathematical formula that measures volatility, which means it shows how the stock price can vary from its true value. The top line, TL, is the same as the middle line a certain number of standard deviations (D) higher than the ML. The bottom line (BL) is the middle line shifted down by the same number of standard deviations.
It is recommended to use 20-period Simple Moving Average as the middle line, and plot top and bottom lines two standard deviations away from it. Besides, moving averages of less than 10 periods are of little effect.
It is best if we use Bollinger Bands with other indicators to see if there is confirmation. In particular, the use of an oscillator like Bollinger Bands will often be coupled with a non-oscillator indicator like chart patterns or a trendline. If these indicators confirm the recommendation of the Bollinger Bands, then we will have greater evidence that what the bands forecast is correct.
Other way of using Bollinger Bands is to buy when price touches the lower Bollinger Bands and exit when price touches the moving average in the center of the bands or we can buy when price breaks above the upper Bollinger Bands and sell when price falls below the lower Bollinger Bands.
As such, they can be used to determine if prices are relatively high or low. Technically, prices are relatively high when above the upper band and relatively low when below the lower band. However, relatively high should not be regarded as bearish or as a sell signal. Likewise, relatively low should not be considered bullish or as a buy signal. Prices are high or low for a reason.
📌 Great Indicators and Trading Systems for MT4 or MT5
- Top-Rated MetaTrader Indicators


- Volatilty Bands Indicator

- Volatilty Bands Percent Indicator

- Voltility Bands Indicator

- Bollinger Bands Multiple Stops Line

- Kalman Bands Indicator

- Projection Bands Indicator

- Tymen Starc Bands MTF Indicator

- Parabolic Moving Average with Bands

- Bollinger Bands Stops MACD

- Quantile Bands V1.5 Indicator

- Kirshenbaum Bands Indicator

- Asymmetric SMA Bands Oscillator

- Dserg Lin Regression Breakout…

- Koli Er Bands Indicator

- Tymen STARC Bands Indicator

- TMA Centered Bands Indicator

- Intraday Breakout Indicator

- Bollinger Bands Stops EMA Deviation

- Bollinger Bands Indicator (MQL5)
")
- Hurst Bands Indicator

- Non-Repainting Non-Lagging Indicators