🆕 Version Released: PRO Indicators for All Markets »
Popular MACD Indicators for MT5 🖇️
Submit your review | |
What is MACD?
Moving Average Convergence Divergence (MACD) is one of the famous technical indicators because of its simplicity, reliability and its effectiveness. Gerald Appel developed this indicator in late 1970s. MACD can be described as trend following momentum indicator.
MACD calculates difference between two exponential moving averages of closing prices. The calculated difference is shown as a histogram or bar graph and the moving average of the difference is charted over time.
Moving averages move along with the market, they widen (diverge) when the market is trending and move closer (converge) when the market is slowing down, thus giving traders an idea about the current market condition.
MACD oscillates above and below the zero line. MACD is unbounded, thus it does not have overbought and oversold levels.
MACD can be represented mathematically as follows:
MACD = EMA [fast, 12] – EMA [slow, 26]
Signal = EMA [period, 9] of MACD
Histogram = MACD – Signal
The default setting for MACD is [12, 26, 9], the 12-day Exponential Moving Average (EMA) less the 26-day EMA. Closing prices are used for these moving averages. A 9-day EMA of MACD is plotted with the indicator to act as a signal line and identify turns. The MACD-Histogram represents the difference between MACD and its 9-day EMA, the signal line. The histogram is positive when MACD is above its 9-day EMA and negative when MACD is below its 9-day EMA.
How to trade MACD
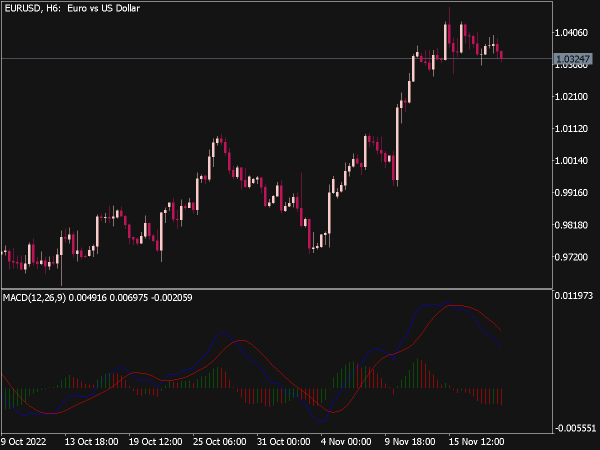
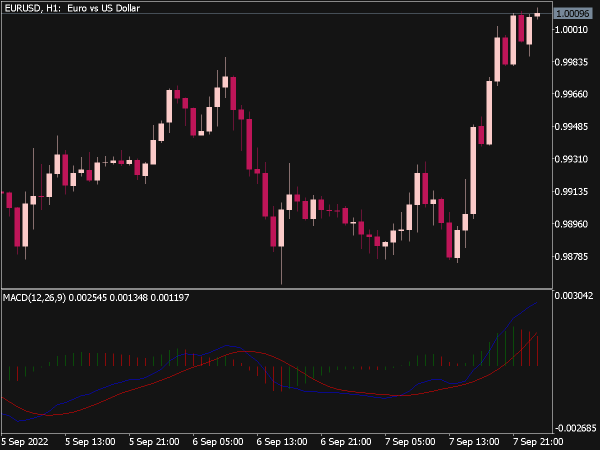
We can trade MACD when crossover occurs. A crossover means when the MACD line (bar line) crosses the 9 EMA line (blue line in the figure 1). Crossover often indicates that a new trend has formed.
From figure 1 above, we can see that the MACD line crossed under the EMA line and correctly identifies a new downtrend. That is when we can enter a short trade. We can also notice the bullish crossover in figure 1 where MACD line crosses over the EMA line thus indicating start of a new uptrend hence we can enter a long trade.
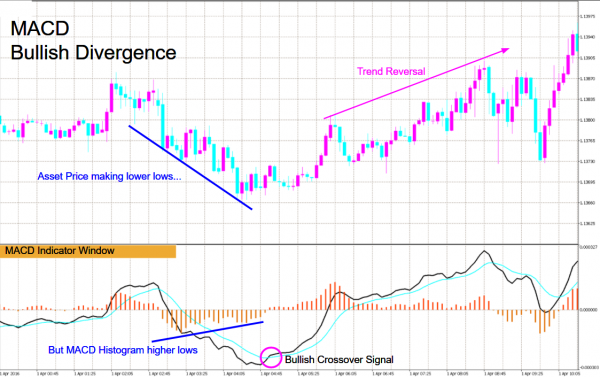
Spotting trend reversal using MACD
We can spot a reversal in a trend using MACD, figure 2 above shows that price has made a consecutive lower low, but if we notice the MACD for the same price levels we can see that MACD histogram is making a higher low, this pattern is called as bullish divergence and this pattern suggest that a trend reversal is possible in near future.
Similar logic can be applied in uptrend also where price makes higher high but MACD histogram makes lower high, this pattern is called as bearish divergence.
More Great MetaTrader Indicators 📌
- Most-Downloaded MT4 Indicators

- Non-Repainting and Non-Lagging Systems
- Best MT5 Color Chart…
 for MetaTrader 5 - TOP 10 in 2024")
- MACD of MACD Indicator

- PTL 2.07 Histo Alerts Lines…

- Macd No Histogram Indicator

- Pivot Lines Interbank Indicator

- Fractal Adjustable Period…

- MACD Colored Histogram

- Macd Adjustable 4c…

- Macd Osma Histogram Indicator

- Adaptive STD RSX Digital…

- S-R Lines Indicator

- Adaptive VHF RSX Digital…

- Pivot Point Lines Indicator

- Hilo Lines Indicator

- Macd Color Histogram Alert…

- Support Resistance Lines Indicator

- Trigger Lines Indicator

- Macd Gaussian Two Lines Nmc…

- Macd All Time Frame…

- CCI T3 MA Cross Arrows…

- Adaptive RSX NRP MTF Alert…

- MT5 Indicators Collection