Submit your review | |
The Momentum indicator is another weapon in the arsenal of traders. The general definition of momentum in trading world is the tendency of a rising pair to rise further, and falling pair to keep falling further. Well, that is what this indicator does, it informs us about the strength of a price movement.
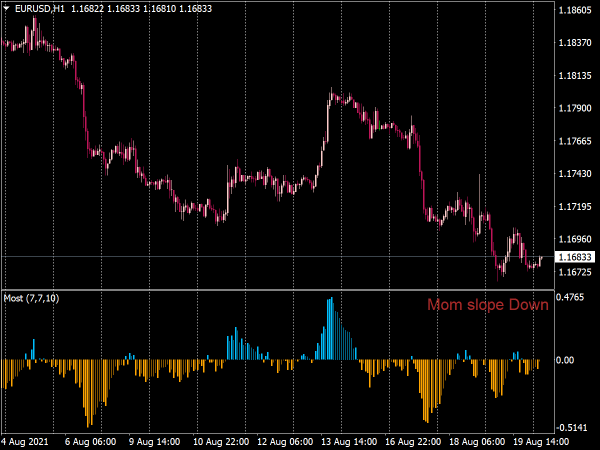
The Momentum indicator is designed to identify the speed of a price movement. Usually, the momentum indicator compares the most recent closing price to a previous closing price, but it can also be used on other indicators such as moving averages. The momentum indicator is usually plotted on a chart below the price. It is displayed as a single line.
The behavior of Momentum indicator is that as the market tops it will climb sharply and then fall off diverging from the continued upward or sideways movement of the price. Similarly, at a market bottom, Momentum will drop sharply and then begin to climb well ahead of prices. Both of these situations result in divergences between the indicator and prices.
Trading with Momentum Indicator
We can buy when the Momentum indicator bottoms and turns up and sell when the indicator peaks and turns down.
However if the momentum indicator extremely reaches high or low values compared to its historical values, we should assume a continuation of the current trend. For example, if the indicator extremely reaches high values and then turns down, we should assume prices will probably continue going higher. In this case, we should only trade after prices confirm the signal generated by the indicator (e.g. if price peaks and turns down, we should wait for the price to begin to fall before selling).
We can also use this indicator as a leading indicator. In this method we assume that market tops are typically identified by a rapid price increase (when everyone expects prices to go higher) and that market bottoms typically end with rapid price declines (when everyone wants to get out). This way we can identify market tops and bottoms.
📌 Great Indicators and Trading Systems for MT4 or MT5
- Top-Rated MetaTrader Indicators


- Trend Histogram System

- Momentum Histogram Indicator

- Forbi Momentum Indicator

- Price Histogram Channel

- Histogram blanket

- IVJempol Histogram

- TrendlessOS Histogram

- Cumulative Momentum Histogram…

- Momentum Divergence

- Dynamic Momentum Oscillator…

- DMX Jurik Histogram Indicator

- Anchored Momentum V2 Indicator

- Envelopes Histogram

- Momentum Detecting

- Trendline Probability Histogram

- FTLM Histogram

- Polychromatic Momentum Indicator

- Dynamic Momentum Oscillator…

- Trend Quality Histogram Oscillator

- Ianch Momentum Indicator

- Non-Repainting Non-Lagging Indicators