If you are new to forex trading, indicators can feel confusing at first. There are hundreds of tools, colorful lines, signals, arrows, oscillators, dashboards, and scanners. After many years of watching live charts, one lesson becomes very clear: beginners do not need more indicators. They need the right indicators, used with simple rules and a calm decision process.
This guide explains the best forex indicators for beginners, how they work, when to use them, what mistakes to avoid, and how to combine them into practical trading ideas. The goal is not to predict every market move. The goal is to build a clear structure so you can make better trading decisions with less emotional pressure.
📌 What Are Forex Indicators?
Forex indicators are chart tools that use price, time, volatility, or mathematical calculations to help traders analyze currency pairs. They are usually displayed directly on the chart or below the chart in a separate indicator window.
Indicators do not control the market. They do not know the future. They simply turn price data into information that is easier to read. A moving average, for example, smooths price action so the trend becomes clearer. RSI measures momentum and can show when a move is stretched, weak, or starting to lose pressure.
Beginner Note
The best indicator is not the one with the most signals. The best indicator is the one that helps you make a clear decision without making your chart messy.
🧩 The Missing Piece Behind Cleaner Forex Entries and Exits


✅ Why Beginners Should Use Indicators Carefully
Indicators can be very helpful, but they can also become dangerous when they are used without a trading plan. Many beginners add five, ten, or even fifteen indicators to one chart and then wonder why they still feel confused.
The problem is usually not the indicator itself. The problem is using too many tools with no clear purpose. Every indicator on your chart should answer one specific trading question.
Trend Question
Is the market moving up, moving down, or ranging sideways?
Momentum Question
Is the current move strong, weak, overextended, or losing power?
Volatility Question
Is the market quiet, active, expanding, or preparing for a breakout?
Entry Question
Is there a reasonable zone to enter, wait, or avoid the trade completely?
📊 Quick Comparison: Best Forex Indicators for Beginners
This table gives you a simple overview of the most beginner-friendly forex indicators and their main purpose.
| Indicator | Best For | Beginner Difficulty | Main Weakness | Best Market Type |
|---|---|---|---|---|
| Moving AverageSMA / EMA | Trend direction | Easy | Can lag behind price | Trending markets |
| RSIRelative Strength Index | Momentum and overbought or oversold areas | Easy | Can stay extreme during strong trends | Ranges and pullbacks |
| MACDTrend and momentum | Trend changes and momentum shifts | Medium | Late signals in fast markets | Trend-following setups |
| Bollinger BandsVolatility bands | Volatility, ranges, and breakouts | Medium | False breakout signals | Range and breakout markets |
| ATRAverage True Range | Stop-loss distance and volatility | Easy | Does not show direction | All market types |
| Stochastic OscillatorMomentum oscillator | Pullbacks and short-term momentum | Medium | Can give too many signals | Range markets |
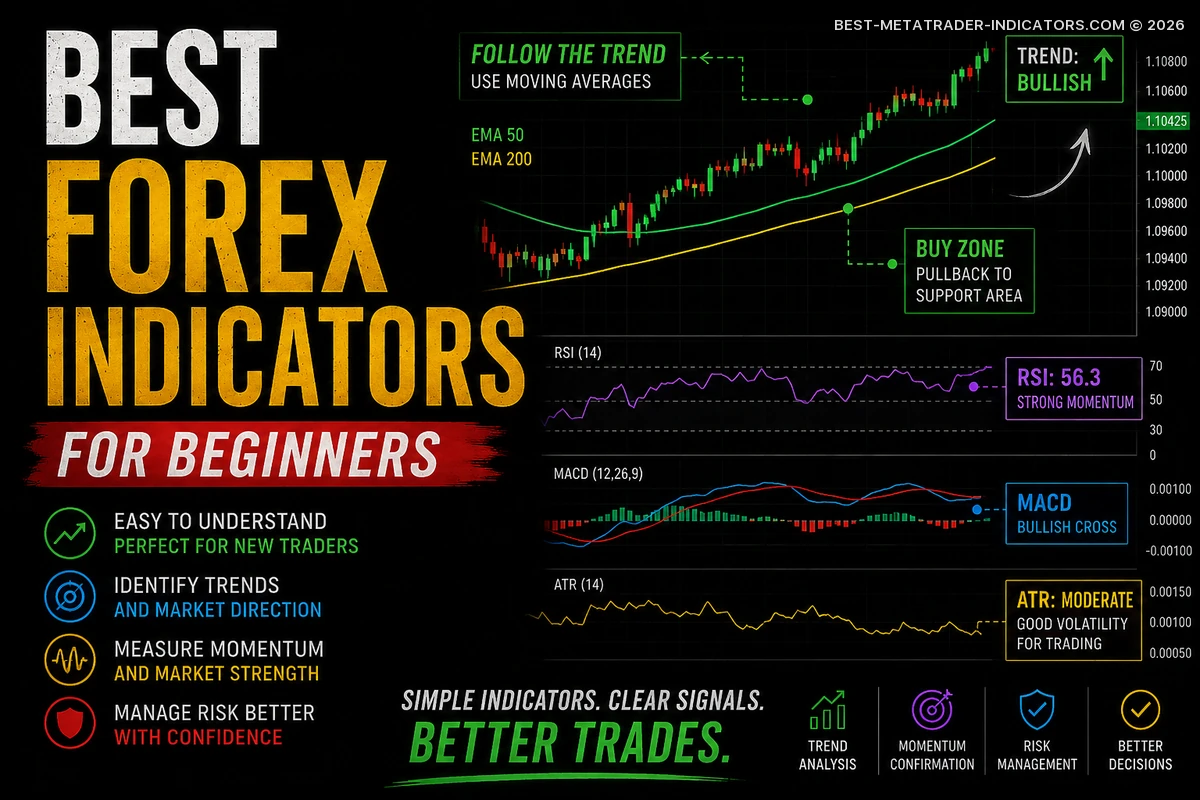
📈 1. Moving Averages: The Best Starting Point for Beginners
Moving averages are one of the most useful forex indicators for beginners because they simplify price action. Instead of reacting to every candle, a moving average helps you see the general direction of the market.
The two most common types are the Simple Moving Average and the Exponential Moving Average. The Simple Moving Average gives equal weight to all prices in the selected period. The Exponential Moving Average reacts faster because it gives more importance to recent prices.
| Moving Average | Common Use | Beginner Tip |
|---|---|---|
| 20 EMA | Short-term trend and pullbacks | Useful for active traders and intraday setups. |
| 50 EMA | Medium-term trend direction | Good for identifying the main market bias. |
| 200 SMA | Long-term trend filter | Price above it often suggests bullish bias; price below it often suggests bearish bias. |
Simple Moving Average Idea
If price is above the 50 EMA and the 50 EMA is sloping upward, beginners can mainly look for buying opportunities. If price is below the 50 EMA and the 50 EMA is sloping downward, beginners can mainly look for selling opportunities.
⚡ 2. RSI: A Simple Momentum Indicator
The Relative Strength Index, usually called RSI, is a momentum indicator. It moves between 0 and 100 and helps traders understand whether a market may be overbought, oversold, or losing momentum.
Many beginners learn that RSI above 70 means overbought and RSI below 30 means oversold. That can be useful, but it is not enough. In a strong uptrend, RSI can stay high for a long time. In a strong downtrend, RSI can stay low for a long time.
RSI Above 70
The market may be overextended, but it does not automatically mean you should sell.
RSI Near 50
This area can act as a momentum balance zone during pullbacks.
RSI Below 30
The market may be oversold, but it does not automatically mean you should buy.
🔄 3. MACD: Trend and Momentum in One Tool
MACD stands for Moving Average Convergence Divergence. It is popular because it combines trend and momentum information. Beginners often use MACD to spot possible changes in direction or confirm the strength of a move.
The MACD indicator usually includes the MACD line, signal line, and histogram. When the MACD line crosses above the signal line, it can suggest bullish momentum. When it crosses below the signal line, it can suggest bearish momentum.
Important MACD Warning
Do not take every MACD crossover as a trade. MACD signals are stronger when they agree with the trend, support and resistance, and the overall market structure.
🌊 4. Bollinger Bands: Understanding Volatility
Bollinger Bands help traders understand volatility. The bands expand when the market becomes more active and contract when the market becomes quieter. This makes them useful for identifying range conditions, possible breakout setups, and overextended price moves.
Beginners should avoid thinking that touching the upper band always means sell or touching the lower band always means buy. In strong trends, price can ride the band for a long time.
Beginner Bollinger Band Strategy Idea
When the bands become narrow, the market may be preparing for a larger move. Wait for a breakout candle, then look for confirmation from trend direction, support and resistance, or momentum before entering.
🛡️ 5. ATR: A Risk Management Indicator Every Beginner Should Know
ATR stands for Average True Range. Unlike many other indicators, ATR does not tell you whether to buy or sell. Instead, it tells you how much the market is moving on average. This is very useful for stop-loss placement.
Many beginners place their stop-loss too close to the entry. The result is simple: they get stopped out by normal market noise. ATR helps you avoid this by showing the current volatility of the pair.
Practical ATR Tip
If ATR is high, the market is moving more aggressively and your stop-loss may need more room. If ATR is low, the market is quieter and smaller stops may be possible. Always combine ATR with your risk percentage and position size.
🎯 6. Stochastic Oscillator: Useful for Pullbacks and Ranges
The Stochastic Oscillator is another momentum indicator. It is often used to identify overbought and oversold conditions, especially in range-bound markets. For beginners, it can be helpful when looking for pullbacks inside a larger trend.
However, the Stochastic can produce many signals. That is why it should not be used alone. It works better when combined with trend direction, moving averages, and important price levels.
📡 Advanced Signal Intelligence for MT4 & MT5 Traders
🧠 The Best Indicator Combination for Beginners
The best forex indicators for beginners are usually not used alone. A simple combination can help you filter bad trades and focus only on cleaner setups.
Simple Beginner Setup
- 50 EMA for trend direction
- RSI for momentum confirmation
- ATR for stop-loss planning
- Support and resistance for entry zones
Why This Works
- The 50 EMA keeps you aligned with the trend.
- RSI helps you avoid weak momentum.
- ATR improves risk management.
- Support and resistance add real chart context.
🚀 Beginner Strategy Idea: Trend Pullback Setup
This is one of the simplest forex strategies for beginners because it avoids chasing price. Instead of buying after a huge candle or selling after a big drop, you wait for the market to pull back into a better area.
| Step | Rule | Purpose |
|---|---|---|
| 1 | Check if price is above or below the 50 EMA. | Identify trend direction. |
| 2 | Wait for price to pull back toward the EMA or a support/resistance area. | Avoid entering too late. |
| 3 | Check RSI for momentum confirmation. | Confirm that the move still has strength. |
| 4 | Use ATR to estimate a realistic stop-loss distance. | Protect the trade from normal volatility. |
| 5 | Target the next logical support or resistance zone. | Plan the trade before entering. |
Risk Reminder
No indicator strategy wins every trade. Beginners should risk only a small percentage of their account per trade and avoid increasing lot size after losses.
📝 Beginner Forex Indicator Checklist
Before opening a trade, use this simple checklist. It can help you slow down and avoid emotional decisions.
Pre-Trade Checklist
- Is the market trending or ranging?
- Is price above or below the main moving average?
- Does RSI confirm momentum or warn of exhaustion?
- Is there a clear support or resistance level nearby?
- Is the stop-loss placed beyond normal market noise?
- Is the potential reward larger than the risk?
- Is the setup clean, or are you forcing a trade?
- Would you still take this trade if you were not afraid of missing out?
💡 Practical Tips for Using Forex Indicators
Use Fewer Indicators
Two or three good indicators are often better than ten confusing ones. A clean chart leads to cleaner decisions.
Start on Higher Timeframes
Beginners often make better decisions on H1, H4, and daily charts because there is less noise than on very small timeframes.
Do Not Ignore Price Action
Indicators are helpful, but support, resistance, trendlines, candles, and market structure still matter.
Backtest Your Rules
Before risking real money, test your indicator setup on historical charts and write down the results.
⚠️ Common Indicator Mistakes Beginners Make
- Using too many indicators: More indicators do not automatically mean better analysis.
- Entering every signal: A signal is not a complete trading plan.
- Ignoring the trend: Counter-trend trades are usually more difficult for beginners.
- Ignoring market structure: A signal near a poor chart location is still a weak trade.
- Moving the stop-loss emotionally: Indicators cannot protect you if you break your own rules.
- Looking for a perfect system: No indicator works perfectly in every market condition.
📉 Indicators vs. Price Action: Which Is Better?
This is a common question. The answer is simple: beginners do not need to choose only one. Indicators and price action can work together.
Price action shows what the market is doing directly. Indicators help organize that information. For example, a support level becomes more interesting when it also matches a moving average pullback and RSI momentum confirmation.
| Method | Strength | Weakness |
|---|---|---|
| Indicators | Clear visual signals and structure | Can lag and create false signals |
| Price Action | Direct view of market behavior | Can feel subjective for beginners |
| Combined Approach | Better confirmation and context | Requires discipline and simple rules |
🧩 Best Indicator Settings for Beginners
There is no magic setting that works forever. Still, beginners can start with standard settings and only adjust them after testing.
Moving Average
Start with 20 EMA, 50 EMA, and 200 SMA. Use them mainly for trend direction and pullback zones.
RSI
Use the standard 14-period RSI. Watch the 30, 50, and 70 levels for momentum context.
ATR
Use 14-period ATR to estimate volatility and avoid placing stops too close to the entry.
📋 Simple Trading Plan Template for Beginners
Example Trading Plan
- Market: Major forex pairs such as EUR/USD, GBP/USD, USD/JPY.
- Timeframe: H1 or H4 for cleaner signals.
- Trend Filter: 50 EMA and 200 SMA.
- Momentum Filter: RSI 14.
- Risk: 1% or less per trade.
- Entry: Pullback to trend area plus confirmation candle.
- Stop-Loss: Beyond structure or based on ATR.
- Take-Profit: Next support/resistance or at least a positive risk-reward ratio.
🚀 Advanced Forex Tools for Traders Who Want an Edge
❓ FAQs About the Best Forex Indicators for Beginners
What is the best forex indicator for beginners?
The moving average is often the best starting point because it helps beginners understand trend direction quickly and clearly.
Can forex indicators predict the market?
No. Indicators analyze past and current price data. They can help with probabilities, but they cannot guarantee future price movement.
How many indicators should a beginner use?
Most beginners should start with two or three indicators. A trend indicator, a momentum indicator, and a volatility tool are enough.
Is RSI good for forex trading?
Yes, RSI can be useful for momentum analysis, pullbacks, and overbought or oversold areas. It works best when combined with trend direction.
Are paid indicators better than free indicators?
Not always. A paid indicator is only useful if it gives clear value, saves time, improves decision-making, or fits a tested trading plan.
What is the biggest mistake beginners make with indicators?
The biggest mistake is treating indicator signals as guaranteed entries instead of using them as part of a complete trading plan.
🏁 Final Thoughts: Keep It Simple and Trade with Structure
The best forex indicators for beginners are not complicated. Moving averages, RSI, MACD, Bollinger Bands, ATR, and the Stochastic Oscillator can all be useful when they are used with a clear purpose.
Start simple. Use one indicator for trend direction, one for momentum, and one for risk or volatility. Combine them with support and resistance, write down your rules, and test your strategy before trading with real money.
In forex trading, the goal is not to find a perfect indicator. The goal is to build a repeatable process that helps you stay calm, protect your capital, and make better decisions over time.
Disclaimer: Trading forex and CFDs involves risk. This article is for educational purposes only and does not provide financial advice, investment recommendations, or guaranteed trading results. Always test your strategy, manage your position size, and never risk money you cannot afford to lose.
📌 Great Indicators and Trading Systems for MT4 or MT5
- Top-Rated MetaTrader Indicators


- Trend Indicator MTF

- Swing Trading MTF Indicator

- BOT X4 MTF Indicator

- Step One More Average MTF Indicator

- CCI Candles MTF Indicator

- SSA of WPR MACD MTF Indicator

- TMAx3 MTF Indicator

- MACD Pivots Indicator MTF

- MA Channels FIBO MTF Indicator

- Custom Candles MTF Indicator

- Stochastic MTF Buy Sell Indicator

- T3 Coral MTF Indicator

- RSI Trader MTF Indicator

- CCI Os CCI MTF Indicator

- HMA Color NRP MTF Alerts Indicator

- ASMFI Rainbow MTF Indicator

- ADXm Smoothed MTF Indicator

- Keltner X2 MTF TT Indicator

- Ichimoku MTF Alerts Indicator

- Trend Scalp MTF Alert Indicator

- Premium Indicators for MT4 and MT5