Forex indicators are not magic signals. They are decision-support tools. When used correctly, they help you filter noisy price action, confirm trade ideas, avoid weak setups and manage risk with more discipline.
After more than two decades around live charts, one lesson becomes impossible to ignore: the best Forex indicators are not always the most complex ones. The real edge comes from combining the right indicators with price action, market structure, risk management, patience and clean execution.
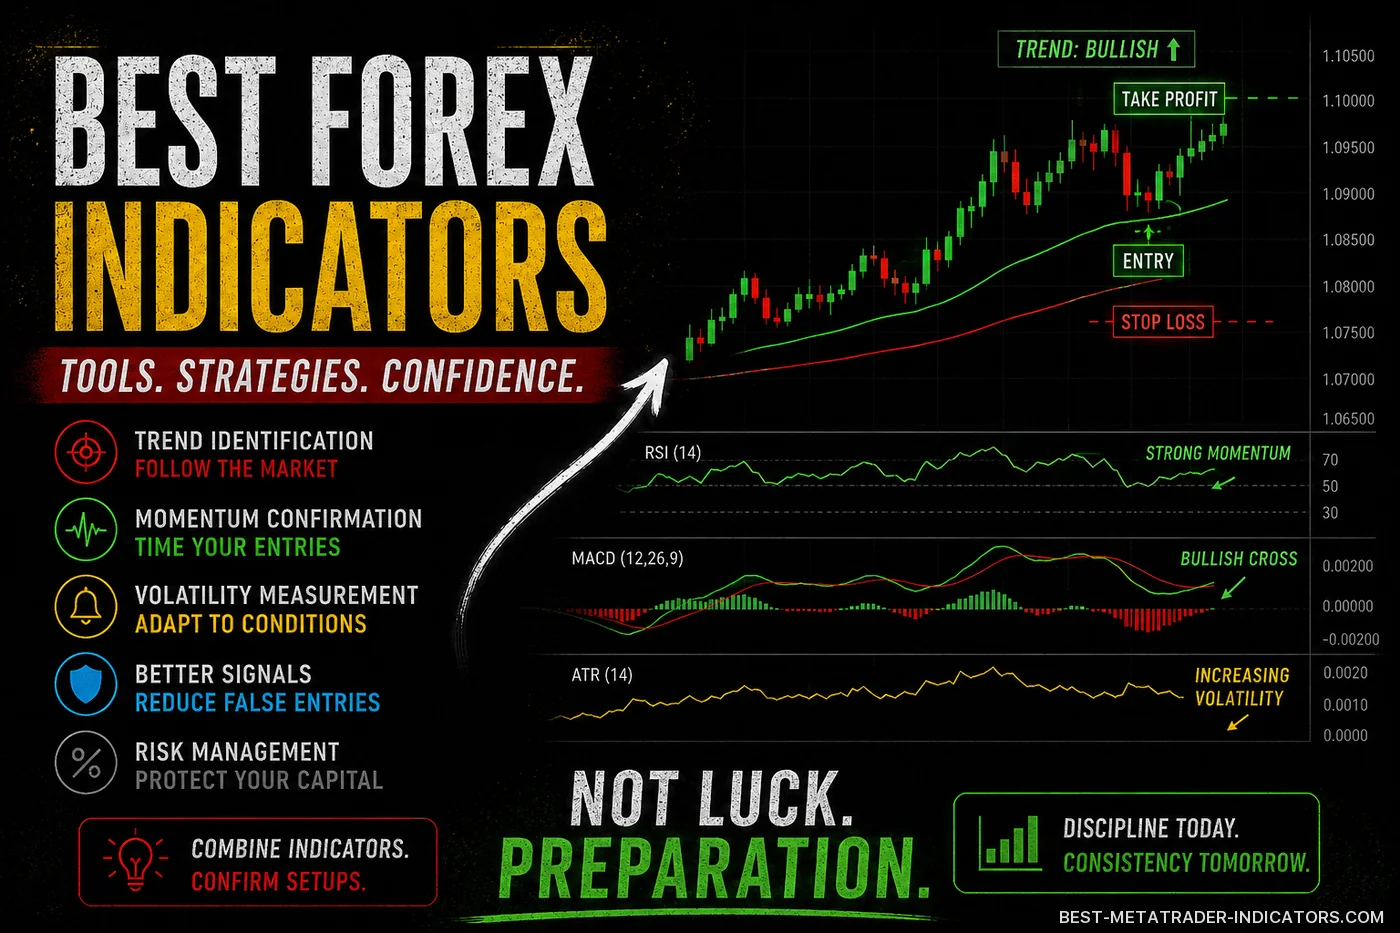
🔥 Upgrade Your Trading with Professional Forex Indicators


📌 What Are Forex Indicators?
Forex indicators are mathematical tools that analyze price, volatility, momentum or trend behavior. They turn raw market movement into visual information, helping traders understand what price may be doing right now.
Some indicators show trend direction. Others highlight overbought or oversold conditions, volatility expansion, potential support and resistance, or changes in market momentum. Used in context, they can make a chart easier to read; used blindly, they can make trading more confusing.
🧠 Trader’s Note
The goal is not to find an indicator that predicts every move. The goal is to build a repeatable process that helps you make better decisions while the outcome is still uncertain.
📈 The Best Forex Indicators by Category
There are hundreds of indicators available for MetaTrader, TradingView and other trading platforms. Still, most useful tools fall into a few practical categories, and each category answers a different trading question.
📉 Trend Indicators
Help identify whether the market is moving up, down or sideways.
- Moving Averages
- MACD
- Ichimoku Cloud
- ADX
⚡ Momentum Indicators
Help measure the strength or weakness behind price movement.
- RSI
- Stochastic Oscillator
- CCI
- Momentum Indicator
🌊 Volatility Indicators
Help detect expanding or contracting market conditions.
- Bollinger Bands
- ATR
- Keltner Channels
- Donchian Channels
🔍 1. Moving Averages
Moving averages are among the most popular Forex indicators because they smooth price data and make the overall trend easier to read. On a messy chart, a good moving average can quickly show whether price is respecting a directional bias or losing structure.
The two most common types are the Simple Moving Average and the Exponential Moving Average. The EMA reacts faster to recent price changes, while the SMA is smoother and slower. Many MetaTrader traders use both, depending on whether they want faster entries or cleaner trend confirmation.
🛠️ How traders use moving averages
- Identify trend direction using the 50 EMA or 200 EMA.
- Look for dynamic support and resistance around moving averages.
- Use moving average crossovers as trend-change alerts.
- Filter trades by taking only buys above a key moving average and sells below it.
⚠️ Common Mistake
Many beginners buy or sell every moving average crossover. In ranging markets, this can lead to repeated false signals. Always check market structure first and ask whether price is actually trending or simply rotating inside a range.
⚡ 2. Relative Strength Index RSI
The Relative Strength Index, commonly called RSI, is a momentum oscillator. It helps traders identify overbought, oversold and momentum-shift conditions, especially when price is approaching a clear support or resistance zone.
Traditional RSI levels are 70 for overbought and 30 for oversold. Experienced traders usually use RSI in context rather than treating those levels as automatic buy or sell signals. A bullish market can hold elevated RSI readings for longer than impatient sellers expect.
✅ Useful RSI Ideas
- RSI above 50 often supports bullish momentum.
- RSI below 50 often supports bearish momentum.
- Divergence can warn of weakening momentum.
- RSI pullbacks can help time entries in trending markets.
⚠️ RSI Caution
A strong trend can keep RSI overbought or oversold for a long time. Selling only because RSI is above 70 can be dangerous during strong bullish trends, especially when higher timeframes still support continuation.
📊 3. MACD
MACD stands for Moving Average Convergence Divergence. It combines trend and momentum information and is often used to detect changes in market direction or confirm that momentum is building behind a move.
The MACD consists of the MACD line, signal line and histogram. Traders usually watch for crossovers, histogram expansion and divergence. The best signals often appear when MACD agrees with the broader trend and price is breaking or retesting a meaningful structure level.
📌 Practical MACD Tip
MACD works better when used with a trend filter. For example, a bullish MACD signal above the 200 EMA is usually more meaningful than the same signal against a strong downtrend.
🌊 4. Bollinger Bands
Bollinger Bands are volatility-based indicators. They expand when volatility increases and contract when volatility decreases, giving traders a quick visual feel for whether price is calm, stretched or starting to move with force.
They are useful for identifying volatility squeezes, strong directional movement and possible mean-reversion areas. The key is to separate a trending market from a ranging market before deciding how to trade the bands.
🧩 Popular Bollinger Band Uses
- Squeeze setups: Low volatility may come before a strong breakout.
- Trend riding: Price can walk along the outer band during strong trends.
- Mean reversion: In ranging markets, price may return toward the middle band.
- Breakout confirmation: Band expansion can confirm stronger volatility.
🧭 5. Average Directional Index ADX
The ADX helps measure trend strength. It does not tell you whether the trend is bullish or bearish by itself. Instead, it shows whether the market has enough directional strength to support trend-following strategies.
Many traders use ADX above 20 or 25 as a sign that the market is trending. A low ADX may suggest range-bound conditions. In practice, ADX is often more useful as a strategy filter than as an entry trigger.
✅ Smart Use
Use ADX to decide which strategy type fits the market. Trend-following systems usually need stronger ADX. Range strategies often work better when ADX is low and price is respecting clear horizontal levels.
🛡️ 6. Average True Range ATR
ATR measures volatility. It does not provide buy or sell signals, but it is extremely useful for stop-loss placement, position sizing and trade management. For serious traders, ATR is often more valuable than another entry indicator.
For example, if EUR/USD has a very low ATR, a large stop loss may be unnecessary. If GBP/JPY has a high ATR, a tight stop loss may be too easy to hit. Matching stop distance to volatility helps reduce emotional exits and random stop-outs.
🎯 ATR Trading Tips
- Use ATR to avoid placing stops too close to market noise.
- Adjust position size when volatility increases.
- Use ATR-based trailing stops for trend trades.
- Compare current ATR with previous sessions to understand volatility changes.
☁️ 7. Ichimoku Cloud
The Ichimoku Cloud is a complete trend-following system. It shows support, resistance, trend direction, momentum and potential future structure. This makes it especially useful when a trader wants more than one layer of confirmation on the same chart.
Although it may look complicated at first, many traders use it because it gives a broad view of market conditions in one indicator. Once the chart is understood, Ichimoku can help separate clean continuation setups from low-quality trades stuck inside noise.
📘 Basic Ichimoku Interpretation
- Price above the cloud suggests bullish bias.
- Price below the cloud suggests bearish bias.
- A thick cloud may act as stronger support or resistance.
- Signals inside the cloud are often less reliable.
⏱️ Best For
Ichimoku is often useful for swing trading, trend continuation setups and higher timeframe analysis, especially when the trader prefers a structured, rules-based chart view.
🧩 Indicator Comparison Table
Here is a practical comparison of popular Forex indicators and how they are commonly used by traders in technical analysis.
| Indicator | Category | Best Use | Weakness | Trader Rating |
|---|---|---|---|---|
| Moving AverageSMA, EMA, WMA | Trend | Trend direction and dynamic support or resistance | Lagging signals in fast reversals | |
| RSIMomentum oscillator | Momentum | Momentum shifts, divergence and pullback timing | Can stay overbought or oversold during strong trends | |
| MACDTrend and momentum | Hybrid | Momentum confirmation and trend changes | Late signals in choppy markets | |
| Bollinger BandsVolatility bands | Volatility | Squeeze, breakout and mean-reversion setups | False breakouts without confirmation | |
| ATRVolatility measurement | Risk Management | Stop-loss distance and position sizing | Does not provide direction | |
| ADXTrend strength | Trend Strength | Filtering trending versus ranging markets | Does not show trend direction alone |
📊 Discover Advanced Forex Tools Trusted by Serious Traders
🎯 Best Forex Indicator Combinations
No single indicator gives a complete picture. A stronger approach is to combine indicators that measure different things. Avoid stacking five indicators that all show the same information, because that usually creates false confidence rather than a better trading decision.
| Strategy Type | Useful Indicators | Purpose |
|---|---|---|
| Trend Following | 200 EMA + MACD + ATR | Find trend direction, confirm momentum and manage stop distance. |
| Pullback Trading | 50 EMA + RSI + Support/Resistance | Trade in the trend direction after controlled retracements. |
| Breakout Trading | Bollinger Bands + ATR + Market Structure | Detect volatility expansion and avoid weak breakouts. |
| Range Trading | RSI + Bollinger Bands + Horizontal Levels | Find potential mean-reversion entries near range extremes. |
| Swing Trading | Ichimoku + MACD + ATR | Follow larger trend moves with structured trade management. |
🧠 A Simple Forex Indicator Strategy
Here is a beginner-friendly strategy idea that combines trend, momentum and risk management. It is simple enough to test, but structured enough to prevent random entries.
📌 EMA + RSI + ATR Pullback Strategy
- Use the 200 EMA to define the main trend direction.
- Look only for buy setups when price is above the 200 EMA.
- Look only for sell setups when price is below the 200 EMA.
- Wait for price to pull back toward a key moving average or support/resistance zone.
- Use RSI to confirm that momentum is turning back in the trend direction.
- Use ATR to place a realistic stop loss beyond normal market noise.
- Target the next logical support or resistance area.
⚠️ Risk Warning
This is an educational strategy idea, not financial advice. Always test any strategy on historical data and a demo account before trading real money. A setup is only useful when you know its rules, its weakness and the risk you are accepting.
📝 Indicator Selection Checklist
Before adding a new indicator to your chart, ask yourself whether it truly improves your decision-making process. A clean chart with clear rules is usually stronger than a crowded chart with ten conflicting signals.
✅ Use an indicator if it helps you:
- Identify the trend more clearly.
- Filter low-quality setups.
- Improve entry timing.
- Place better stop losses.
- Manage trades with more structure.
🧹 Remove an indicator if it:
- Repeats the same information as another indicator.
- Makes your chart harder to read.
- Creates confusion instead of clarity.
- Encourages impulsive trades.
- Has not been tested properly.
💡 Practical Tips for Using Forex Indicators
- Start simple: One trend indicator, one momentum indicator and one volatility tool are often enough.
- Respect higher timeframes: A signal on the 5-minute chart is weaker if the 4-hour trend is strongly opposite.
- Do not ignore price action: Indicators should support your chart reading, not replace it.
- Backtest your rules: Never assume an indicator works just because it looks good on one chart.
- Avoid indicator overload: Too many tools can create analysis paralysis.
- Use risk management: Even the best indicator setup can fail.
🚫 Common Forex Indicator Mistakes
🎯 1. Chasing Perfect Signals
No indicator produces perfect entries. Waiting for every indicator to agree can cause late entries or missed trades. In live trading, a clean plan beats a perfect-looking setup that appears after the move is already gone.
🧭 2. Ignoring Market Conditions
A trend indicator may work well in trending markets but perform poorly in ranges. Match your tools to the market environment and check whether price is trending, compressing, breaking out or rotating sideways.
🔧 3. Changing Settings Too Often
Constantly adjusting indicator settings can create curve-fitting. Keep your rules consistent enough to test properly. If the rules keep changing after every losing trade, you are not testing a strategy; you are reacting emotionally.
📋 4. Trading Without a Plan
Indicators are not a trading plan. You still need entry rules, exit rules, risk limits and a clear reason for every trade. Without those details, even a strong indicator setup can turn into impulsive execution.
📋 Best Forex Indicators for Different Trading Styles
| Trading Style | Recommended Indicators | Reason |
|---|---|---|
| Scalping | EMA, VWAP-style tools, RSI, ATR | Fast trend reading, momentum timing and volatility control. |
| Day Trading | Moving Averages, MACD, Bollinger Bands, ATR | Useful for intraday trend, breakout and reversal setups. |
| Swing Trading | Ichimoku, 50 EMA, 200 EMA, MACD | Better for larger market structure and multi-day moves. |
| Position Trading | 200 EMA, ADX, ATR, Support/Resistance | Helps filter major trend direction and long-term volatility. |
| Range Trading | RSI, Stochastic, Bollinger Bands | Helpful for identifying stretched price conditions inside ranges. |
🔧 Best Indicator Settings: Should You Change Defaults?
Default settings are not always perfect, but they are often a good starting point because many traders watch them. The more you change settings, the more important it becomes to test whether the new version actually improves results. Settings should serve the strategy, not the trader’s need to keep searching for comfort.
📈 Moving Average
Popular settings include 20, 50, 100 and 200 periods. Shorter settings react faster but create more noise. Longer settings are slower, but they often give a cleaner view of the dominant structure.
⚡ RSI
The classic setting is 14 periods. Some short-term traders use faster settings, but they can produce more false signals. Whatever setting you use, test it against your actual entry and exit rules.
🛡️ ATR
A 14-period ATR is common. The key is not the exact setting, but using volatility consistently in your risk plan. ATR becomes powerful when it keeps your stop loss outside normal price noise without making the position size too large.
✅ Final Trader Checklist
📋 Before taking a trade, confirm:
- The market condition is clear: trending, ranging or breaking out.
- Your indicator signal matches the broader market structure.
- You know your entry, stop loss and target before entering.
- Your risk per trade is controlled and acceptable.
- You are not entering only because of one indicator signal.
- The trade fits your written trading plan.
❓ Frequently Asked Questions
🏆 What is the best Forex indicator?
There is no single best Forex indicator for every trader. Moving averages, RSI, MACD, Bollinger Bands and ATR are among the most useful because they cover trend, momentum and volatility. The best choice depends on your trading style and your rules.
🔮 Can indicators predict the Forex market?
No indicator can predict the market with certainty. Indicators analyze past and current price data. They can support decisions, but they cannot remove risk. A professional trader treats them as tools, not guarantees.
🧩 How many indicators should I use?
Most traders do not need more than two or three indicators. A clean setup is usually better than a crowded chart full of conflicting signals. One trend tool, one momentum tool and one volatility tool can already cover a lot.
💰 Are paid indicators better than free indicators?
Not always. Some free indicators are excellent, while some paid indicators are overmarketed. The real question is whether the tool fits your strategy, works on your MetaTrader setup and has been tested properly.
🌱 Which indicator is best for beginners?
Moving averages and RSI are good starting points because they are easy to understand and widely used. ATR is also important because it helps with risk management, which is often where beginners make the most expensive mistakes.
👨💻 Do professional traders use indicators?
Many professional traders use indicators, but usually as part of a broader system that includes market structure, price action, risk management and execution rules. They rarely rely on one signal without context.
🚀 Take Your Trading to the Next Level with Pro Indicators
🏁 Final Thoughts
The best Forex indicators are the ones that help you make clearer, more consistent and better-controlled trading decisions. They should reduce confusion, not create it.
For most traders, a simple combination such as a moving average for trend, RSI or MACD for momentum, and ATR for volatility can provide a strong foundation. Add price action, support and resistance, structured entries, defined stop loss placement and realistic take profit planning, and you will have a much more professional trading process.
Remember: indicators do not make money by themselves. Discipline, testing, patience and risk control are what turn tools into a real trading edge.
⚠️ Disclaimer
This article is for educational purposes only and does not provide financial advice, investment advice or trading recommendations. Forex trading involves risk, and every trader is responsible for testing strategies, managing position size and deciding whether a setup fits their own risk tolerance.