Submit your review | |
In order to understand candlestick patterns in detail, we must first know about candlesticks. Candlestick chart is a way of representing price in candlestick bars. Candlesticks are a combination of line chart and bar chart. A candlestick tells us about the price (high, low, open, close) for the given period. It is said that Japanese used technical analysis to trade rice in the 17th century.
The highs and lows of the time period are called the "shadow" and the open and close form the "body". The candle itself is the "range". When candle close at the bottom of the range we conclude that the sellers are in control. When candle close at the top of the range we conclude that buyers are in control.
A bullish candlestick is formed when price closes above the open and bearish candlestick is formed when price closes below the open. The color of body for bullish candlestick is white, thus showing bulls control over the market instrument or asset and the bearish candlestick body has black color showing the bears control over the asset.
Now once we have learned to read candlesticks we can move on to identify various candlestick patterns, candlestick pattern is a specific combination of candlesticks that tells us about the current situation of the market. Candlestick patterns can give us invaluable insight into price action at a glance.
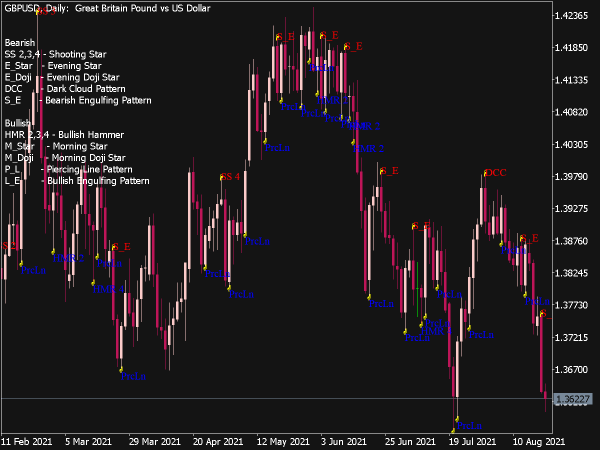
Different types of candlestick patterns:
Engulfing Pattern
Harami
Doji
Piercing Line
Shooting Star
Dark Cloud Cover
Falling Window
Hammer
Hanging Man
Above are some popular candlestick patterns. According to Japanese there are more than 40 candlestick patterns.
📌 More Free Indicators and Trading Systems for MT4 or MT5
- Top-Rated MetaTrader Indicators


- Break of Structure: The…

- AFL Winner Indicator (MQL5)
")
- Demo Buffer Pattern Indicator

- Auto Fibonacci Retracement…
")
- Kicking Pattern Indicator

- DSL RSX Indicator (MQL5)
")
- ADX DMI Indicator (MQL5)
")
- Harmonic Patterns Scanner Indicator

- Bounce Strength Indicator (MQL5)
")
- AMA Slope Indicator (MQL5)
")
- Shved Supply and Demand…
")
- Waddah Attar Explosion…
")
- AMKA Indicator (MQL5)
")
- AFStar Indicator (MQL5)
")
- ADXm VHF Adaptive Indicator (MQL5)
")
- Volume Zone Oscillator V2 (MQL5)
")
- Show Pips Indicator (MQL5)
")
- Perfect Trend Line Indicator (MQL5)
")
- Price Channel Indicator (MQL5)
")
- RSI Bands Indicator (MQL5)
")
- Premium Indicators for MT4 and MT5