Submit your review | |
The CCI gives similar signals as the RSI, but is slightly faster, especially with short movements. The most interesting application is probably to compare its divergences with those in the RSI. In sideways movements, opposite divergences are often found here. The formula is:
((Price((High + Low + Close) / 3) - MA off course) / (0.015 * Sum of mean deviations)
In fact, it tells you how far the current price has moved away from the moving average (MA). The steeper the curve, the stronger the trend, but the greater the risk of a setback. The CCI in the short time frame, e.g. of five days, is less to be used as an oscillator, rather for trend confirmation. Very high values here indicate that the upward movement will continue, very low values indicate that the downward movement will continue.
In a slightly longer time frame, e.g. 13 days, it then shows oversold and overbought levels more often, whereby you always have to pay attention to the trend, because it of course indicates whether a price is relatively high or low, not absolutely. Medium values usually indicate trendless markets, which should be avoided. So you can only trade if the values are above 100 or below – 100 and can then use the CCI as a trend indicator.
The CCI provides very good short-term signals if you filter them and use only those in the direction of the longer-term trend. One can optimize the entry and exit points with the help of zone analysis and with the help of trend analysis and with formations. A special peculiarity lies in the fact that he often forms hooks on the upper and lower center lines, i.e. the two 100 lines, these usually provide better signals than the crossovers and the overbought and oversold situations.
One of its strengths is that it is very well suited for cyclical analysis and it works very well here in all time frames. Its typical weakness is that of all oscillators, that it stays in the extreme zones for a very long time, especially in those where the trend is currently going, similar to Stochastics.
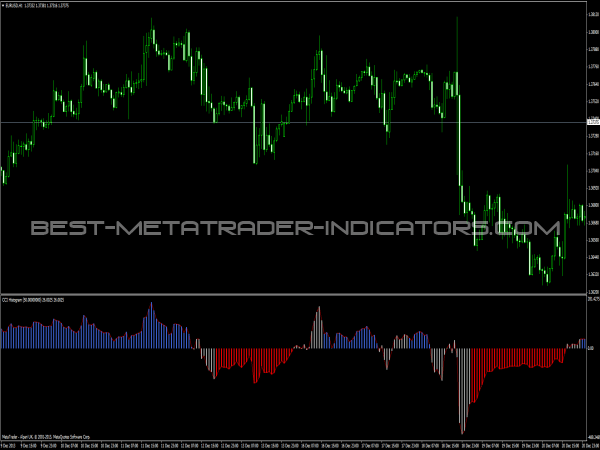
CCI as a trend-following indicator
In larger settings, it works as a trend following indicator with the peculiarity that it shows not only the direction, but also the trend strength when it rises high and steep. At short settings, from 10 bars, on the other hand, it behaves like an oscillator and gives overbought/oversold signals. However, so restless that it is only suitable for very fast traders, with only the signals in the direction of the overarching trend tradable.
The strong volatility of the CCIs requires a very careful handling: even a bar more or less can bring major changes. With daytrading you have to choose ever larger settings from 35 bars, otherwise it is too volatile. A distinctive feature is the hook formation, which works quite well if it takes place near the center line. A special strength of the CCI is that it works equally well in all periods. In addition, it is one of those indicators that are very suitable for cyclical analysis in addition to Momentum, MA, Detrend, etc.
📌 Great Indicators and Trading Systems for MT4 or MT5
- Top-Rated MetaTrader Indicators


- CCI Os CCI MTF Indicator

- MACD OSMA Histogram with Alert…

- Absolute Strength Histogram Indicator

- Envelopes Histogram

- Jurik Smooth Histogram MTF

- DPO Histogram Indicator

- Hama Step Histogram Indicator

- FTLM Histogram

- Price Histogram Channel

- WPR Smooth Histogram MTF Indicator

- Direction Force Histogram Indicator

- Clives Histogram CCI Indicator

- Clear Method Histogram

- Adx Histogram Vma Alerts Indicator

- Ehlers Histogram Oscillator

- MACD Histogram Wis Indicator

- Precision Trend Histogram

- IVJempol Histogram

- QQE Histogram

- CCI Divergence Indicator (MQL4)
")
- Premium Indicators for MT4 and MT5