Submit your review | |
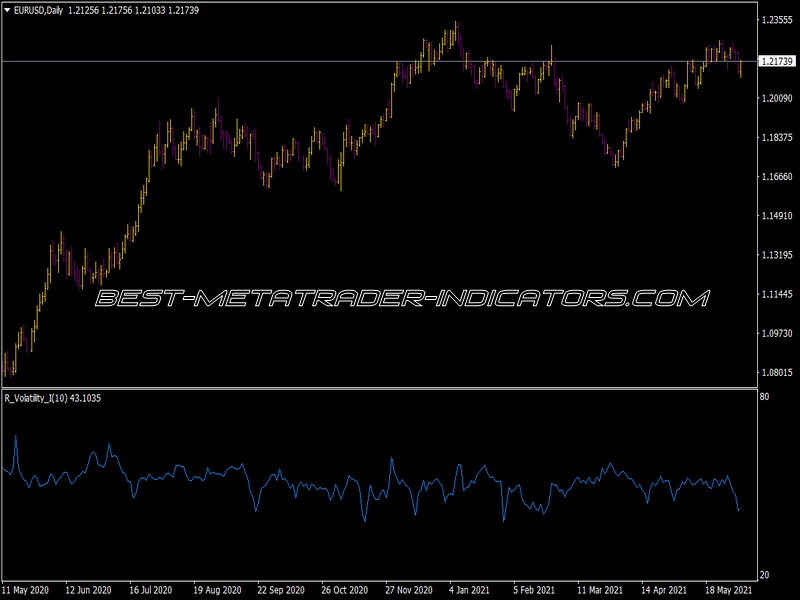
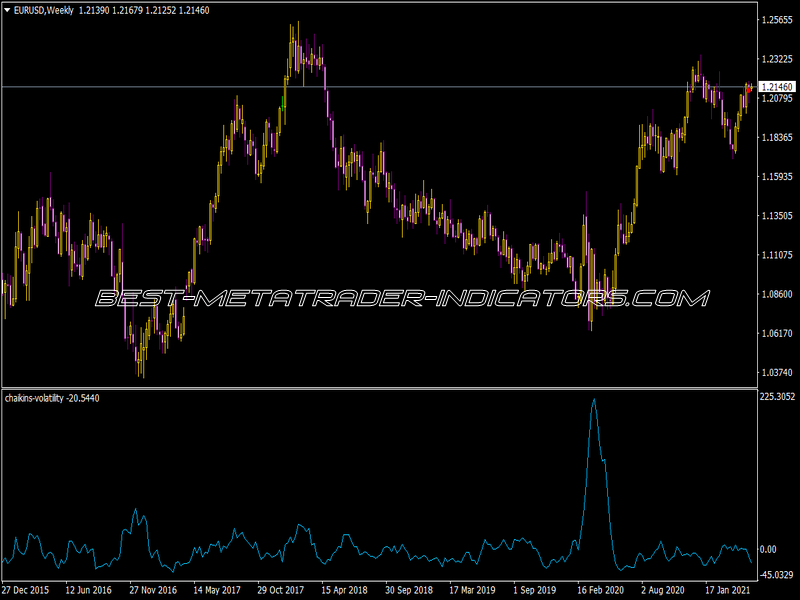
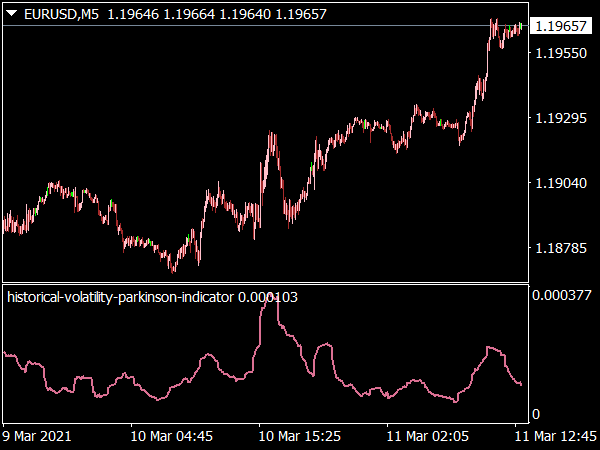
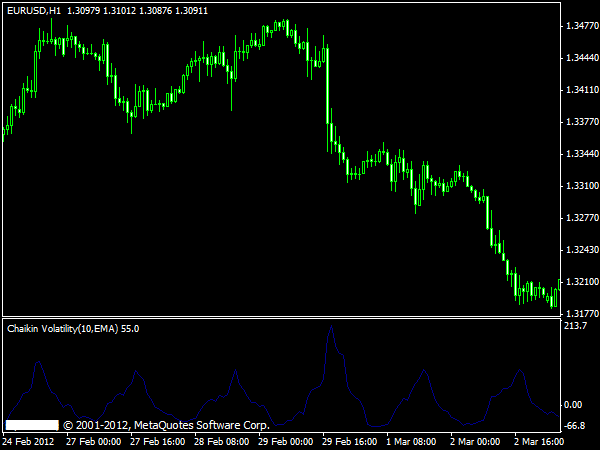
Volatility is understood here as the difference between high and low, the whole thing is connected with the ROC. The formula for a 14 volatility is:
ROC 14(MA 14(high - low))
A steep increase indicates that soil formation is to be expected soon due to the increased volatility and the cyclical behavior of these. Accordingly, a sharp decline speaks in favor of an imminent summit formation. Soil formations in the negative area indicate a possible breakout movement from a sideways movement, that is, for the beginning of a new trend.
If the indicator decreases, false breakouts are found more and more often. So one should then prefer the anti-break systems. In long-lasting trend phases and flat sideways movements, the signals are unclear, but otherwise it hits quite a lot of hooks, so that the interpretation becomes difficult.

