Fibonacci retracement is one of those tools that looks simple on the chart but only becomes useful when it is handled with discipline. Many traders draw the levels, wait for price to touch 38.2%, 50%, or 61.8%, and enter almost automatically. That is not analysis. That is guessing with clean-looking lines.
Used properly, Fibonacci retracement is not a prediction tool and not a shortcut to certainty. It is a structured way to judge where a trend may pause, pull back, and possibly continue. In Forex, where price usually moves through impulses, corrections, sweeps, and continuation legs rather than straight lines, this framework can help with entries, stop-loss placement, partial profits, and realistic trade management.
📌 What Is Fibonacci Retracement?
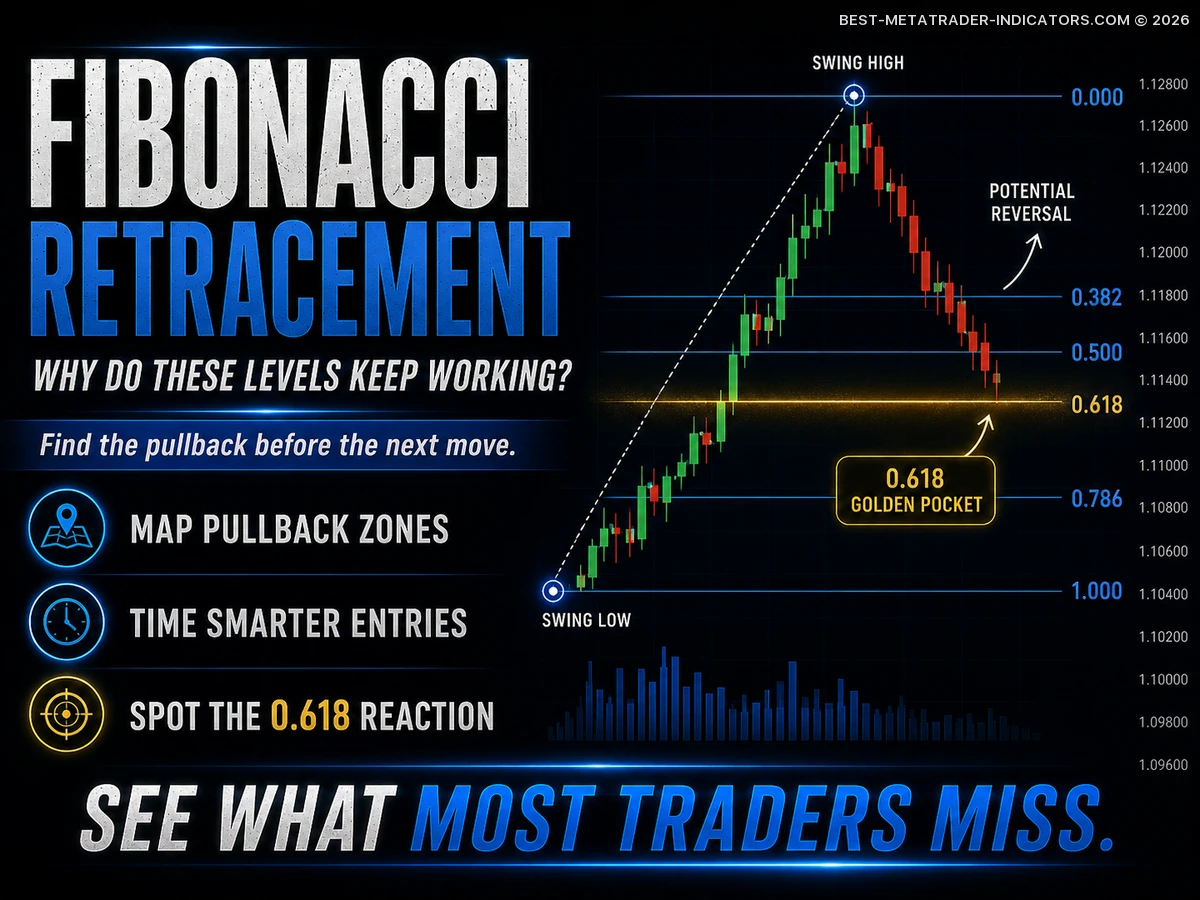
Fibonacci retracement is a technical analysis tool used to measure how far price may correct before the dominant move either resumes or starts to fail. The most watched retracement levels are 23.6%, 38.2%, 50%, 61.8%, and 78.6%. Traders use these levels as areas where order flow may shift, not as guaranteed turning points.
In practice, traders apply the tool from a significant swing low to a swing high in an uptrend, or from a significant swing high to a swing low in a downtrend. The resulting horizontal levels mark potential zones of interest where buyers or sellers may step back in if the broader structure remains intact.
Trader’s note: Fibonacci levels are not exact reversal prices. Treat them as zones, not laser-precise lines. A good setup often forms around a level after a reaction, rejection, or break of minor structure, not simply because price has touched the number.
🚀 Designed for Traders Who Want an Institutional Edge


🧠 Why Forex Traders Use Fibonacci Retracement
Forex price action is driven by liquidity, momentum, volatility, trapped positions, and repeated changes in short-term order flow. Because of that, price rarely travels in a clean straight line. It expands, pauses, pulls back, tests previous structure, shakes out early entries, and then either continues or breaks the trend.
Fibonacci retracement gives traders a framework for answering one practical question: where could the pullback end if the trend is still technically healthy? That question matters because chasing after an extended candle usually creates poor risk-to-reward, while waiting for a controlled retracement often gives a cleaner invalidation point.
Trend Entries
Fibonacci helps traders avoid buying the top of an impulsive move or selling the low after a sharp drop. It encourages patience and gives the trade idea a defined value area.
Risk Planning
By defining a retracement zone, traders can place stops beyond structure instead of hiding them randomly near the entry. This makes the trade easier to evaluate before execution.
Trade Targets
When combined with prior highs, prior lows, and Fibonacci extensions, retracement levels can help map sensible Take Profit zones after a continuation trigger appears.
📈 The Main Fibonacci Levels Explained
Not every Fibonacci level carries the same practical weight. Some levels attract more attention because they sit in areas where traders often reassess trend strength, stop placement, and continuation potential. The key is to understand the character of each level rather than treating all of them as equal signals.
| Level | Meaning | Typical Use |
|---|---|---|
| 23.6% | Very shallow pullback | Often appears when momentum is strong and buyers or sellers defend the move early |
| 38.2% | Healthy trend correction | Common entry zone when the trend is clean and continuation pressure remains visible |
| 50% | Psychological midpoint | Popular because traders often watch the halfway retracement of an impulse leg |
| 61.8% | Golden ratio zone | Often watched for deeper continuation setups when structure has not fully broken |
| 78.6% | Deep retracement | Useful near major structure, but the risk of trend failure is noticeably higher |
🛠️ How to Draw Fibonacci Retracement Correctly
The quality of your Fibonacci analysis depends heavily on where you anchor the tool. Weak swing selection creates weak levels. A common mistake is drawing Fibonacci on every minor movement until the chart becomes crowded and the trader can justify almost any entry.
For an Uptrend
- Identify a clear swing low where buying pressure started.
- Find the latest meaningful swing high that completed the impulse.
- Draw Fibonacci from the swing low to the swing high.
- Watch how price reacts at 38.2%, 50%, and 61.8%.
- Look for confirmation before entering long, such as rejection, a higher low, or a break of minor resistance.
For a Downtrend
- Identify a clear swing high where selling pressure started.
- Find the latest meaningful swing low that completed the impulse.
- Draw Fibonacci from the swing high to the swing low.
- Watch for bearish reactions around the retracement zone.
- Enter only when price action confirms sellers are returning, ideally after a lower high or a break of minor support.
🎯 Strategy 1: Trend Pullback Continuation
This is the classic Fibonacci strategy. The idea is straightforward: find a strong trend, wait for price to pull back into a Fibonacci zone, and enter only when the market shows signs that continuation pressure is returning.
Best conditions: This approach works best when the market is clearly trending, moving averages are aligned with the move, and price is making higher highs and higher lows in an uptrend or lower highs and lower lows in a downtrend.
Entry Idea
In an uptrend, wait for price to pull back into the 38.2% to 61.8% area. Then look for bullish confirmation such as a pin bar, engulfing candle, break of minor structure, failed push lower, or rejection wick. In a downtrend, use the same logic in reverse and wait for evidence that sellers are defending the retracement.
Stop-Loss Idea
Place the Stop Loss beyond the relevant swing structure, not directly on the Fibonacci level. If you enter near the 50% retracement in an uptrend, a logical stop may sit below the 61.8% level or below the swing low, depending on volatility, spread, and the shape of the correction.
Target Idea
The first Take Profit can be the previous swing high in an uptrend or the previous swing low in a downtrend. More advanced traders may scale part of the position there and use Fibonacci extensions such as 127.2% or 161.8% for a second target if momentum continues.
🔥 Strategy 2: Fibonacci Confluence Trading
Fibonacci becomes more useful when it lines up with other technical factors. This is called confluence. A Fibonacci level by itself may be weak. A Fibonacci level that overlaps with support, resistance, trendline structure, a moving average, a liquidity sweep, or a clean price-action trigger is far more interesting.
Good Confluence
- 61.8% retracement near previous resistance turned support
- 50% retracement near a rising 50-period moving average
- 38.2% retracement during a strong momentum trend
- Fibonacci zone aligned with a liquidity sweep and a clear rejection candle
Weak Confluence
- Random Fibonacci level in the middle of a noisy range
- No clear trend direction
- No price action confirmation
- Entry taken while volatility is unstable and the stop has no structural protection
⏱️ Strategy 3: Multi-Timeframe Fibonacci
One of the best ways to improve Fibonacci accuracy is to combine multiple timeframes. For example, use the daily chart to identify the dominant structure, the 4-hour chart to draw the main retracement, and the 1-hour chart to refine the actual entry. This approach is fully compatible with MetaTrader because the built-in Fibonacci tool, moving averages, and price-action analysis can be applied across timeframes without extra indicators.
Multi-timeframe analysis helps you avoid taking small chart signals against the bigger market structure.
| Timeframe | Purpose | What to Look For |
|---|---|---|
| DailyMarket bias | Defines the bigger trend | Trend direction, major swing points, and broad structure |
| 4-HourMain setup | Best area to draw Fibonacci | Clean impulse move, controlled pullback, and clear invalidation |
| 1-Hour / 30-MinuteEntry timing | Refines execution | Candle confirmation, minor break of structure, Stop Loss placement, and risk control |
⚡ Premium Non-Lagging Indicators for MT4 and MT5
💡 Smart Tips from Experience
After watching traders use Fibonacci for years, one thing becomes obvious: the tool is rarely the real problem. The problem is usually impatience. Traders want the level to work because they already want a trade, and that bias makes an ordinary pullback look like a perfect setup.
- Do not force Fibonacci on messy price action. If the swing is unclear, skip it.
- Use zones instead of single lines. Price often pierces a level before reacting.
- Wait for confirmation. The level is the location; price action is the trigger.
- Respect volatility. A fast-moving pair can overshoot a level before the real reaction forms.
- Journal every Fibonacci trade. Track which pairs, sessions, timeframes, and levels perform best for your style.
✅ Fibonacci Trading Checklist
Before taking a Fibonacci retracement trade, run through this checklist. It can save you from many emotional entries and from trades where the risk was never clear in the first place.
- Is there a clear trend or impulse move?
- Did I draw Fibonacci from a meaningful swing high and swing low?
- Is price reacting at a key level such as 38.2%, 50%, or 61.8%?
- Is there confluence with support, resistance, trendline, moving average, or liquidity?
- Do I have a clear entry trigger?
- Is my Stop Loss placed beyond logical structure?
- Is the reward-to-risk ratio worth taking?
- Is volatility reasonable for my planned stop size?
- Am I following my trading plan, or am I chasing?
⚖️ Advantages and Disadvantages
Like every trading tool, Fibonacci retracement has strengths and weaknesses. It can improve structure and timing, but it can also mislead traders who use it without context or who keep redrawing the tool until the chart agrees with their opinion.
Advantages
- Helps avoid chasing extended moves
- Creates structured entry zones
- Works well with trend trading
- Combines easily with support, resistance, and moving averages
- Useful across many Forex pairs and MetaTrader timeframes
Disadvantages
- Subjective swing selection
- Can produce too many possible levels
- Weak in choppy or ranging markets
- Needs confirmation to be reliable
- Can create false confidence for beginners
🚫 Common Mistakes to Avoid
Most Fibonacci mistakes come from using the tool too often, too quickly, or without market structure. The best traders are selective. They understand that no trade is also a position, especially when the retracement is unclear or the Stop Loss would need to be placed in a weak location.
- Entering just because price touches 61.8%. A level is not a signal.
- Drawing Fibonacci against the dominant trend. Countertrend trades require faster management and stronger confirmation.
- Ignoring volatility. Pairs like GBP/JPY may overshoot levels more aggressively than EUR/USD.
- Placing stops too tight. Fibonacci zones often need breathing room.
- Using Fibonacci without a predefined exit plan. If the Stop Loss and Take Profit are unclear, the setup is not ready.
🧩 Fibonacci vs. Support and Resistance
Fibonacci and support/resistance are not competitors. They are better together. Support and resistance show where price has reacted before. Fibonacci shows where a pullback may become attractive inside the current swing. When both point to the same area, the zone deserves more attention.
| Tool | Strength | Best Use |
|---|---|---|
| Fibonacci Retracement | Measures pullback depth | Finding trend continuation zones |
| Support & Resistance | Shows historical reaction areas | Confirming important price zones |
| Best Combination | Fibonacci level overlaps with structure | Higher-quality entries with better context and clearer invalidation |
📊 Example Trade Scenario
Imagine EUR/USD is in a clear uptrend on the 4-hour chart. Price rallies from 1.0800 to 1.1000, then begins to pull back. You draw Fibonacci from 1.0800 to 1.1000. The 50% retracement appears near 1.0900, which also matches previous resistance turned support.
Instead of buying immediately, you wait. Price reaches the zone, forms a bullish rejection candle, and then breaks a minor lower high on the 1-hour chart. That gives you a structured entry. Your Stop Loss goes below the rejection low or below the nearby swing structure, and your first Take Profit is near the previous high at 1.1000.
This is the professional mindset: Fibonacci gives you the area, market structure gives you the reason, price action gives you the trigger, and risk management decides whether the trade is worth taking.
🧭 When Fibonacci Works Best
Fibonacci retracement tends to work best when the market has a clean impulse move followed by a controlled correction. It is less effective when price is moving sideways, overlapping heavily, or printing random spikes without clean structure.
Better Market Conditions
- Clear trending structure
- Strong impulse move
- Controlled pullback
- Visible support or resistance nearby
- Healthy volatility with readable candle closes
Worse Market Conditions
- Choppy sideways range
- Unclear swing points
- Erratic volatility
- Thin liquidity periods
- Random spikes without structure
⚡ Professional FX Indicators That Give You the Trading Edge
❓ FAQs About Fibonacci Retracement
Is Fibonacci retracement reliable?
It can be useful, but it is not reliable as a standalone signal. It becomes stronger when combined with trend direction, support/resistance, liquidity behavior, and price action confirmation.
Which Fibonacci level is the best?
There is no single best level. In strong trends, 38.2% often matters. In deeper pullbacks, 50% and 61.8% are commonly watched. The best level is usually the one with the cleanest confluence and the clearest Stop Loss location.
Can beginners use Fibonacci?
Yes, but beginners should first understand trend structure and support/resistance. Without those basics, Fibonacci lines can become confusing and may encourage entries that have no real technical backing.
Does Fibonacci work on all Forex pairs?
It can be applied to all major, minor, and exotic pairs, but behavior differs. Major pairs often respect structure more cleanly, while volatile crosses may overshoot levels before reacting.
Should I use Fibonacci on lower timeframes?
You can, but lower timeframes contain more noise. Many traders get better results by using higher timeframes for direction and lower timeframes only for entry timing, Stop Loss refinement, and execution.
Can Fibonacci predict reversals?
Not exactly. Fibonacci highlights potential reaction zones. Whether a reversal or continuation actually happens must be confirmed by price behavior, structure, and the way candles close around the level.
🏁 Final Thoughts
Fibonacci retracement is not a secret code hidden inside the Forex market. It is a practical visual framework for measuring pullbacks, planning entries, and controlling risk. The traders who benefit from it are not the ones who draw the most lines. They are the ones who wait for the cleanest structure.
If you remember only one thing, remember this: Fibonacci does not make the trade. Confluence, confirmation, and risk management make the trade. Use the tool with patience, test it across your preferred pairs and timeframes, journal the results, and let actual trade data shape your strategy.
Risk disclaimer: Forex trading involves significant risk and is not suitable for every trader. This article is for educational purposes only and does not constitute financial advice. Always trade with a tested plan, define your Stop Loss and Take Profit before entry, and risk only capital you can afford to lose.