The footprint indicator is one of the most useful order-flow tools available to active traders. A standard candlestick shows the open, high, low, and close. A footprint chart goes deeper by showing how much volume traded at each price level, which side was more aggressive, and where buyers or sellers may have been caught on the wrong side of the move.
For Forex traders, especially those trading major pairs such as EUR/USD, GBP/USD, USD/JPY, XAU/USD, or index CFDs, footprint analysis adds a valuable layer of execution context. It does not predict the next candle on its own, but it can show whether a move is backed by real participation or is running mainly on thin liquidity and short-lived momentum.
🧠 What Is a Footprint Indicator?
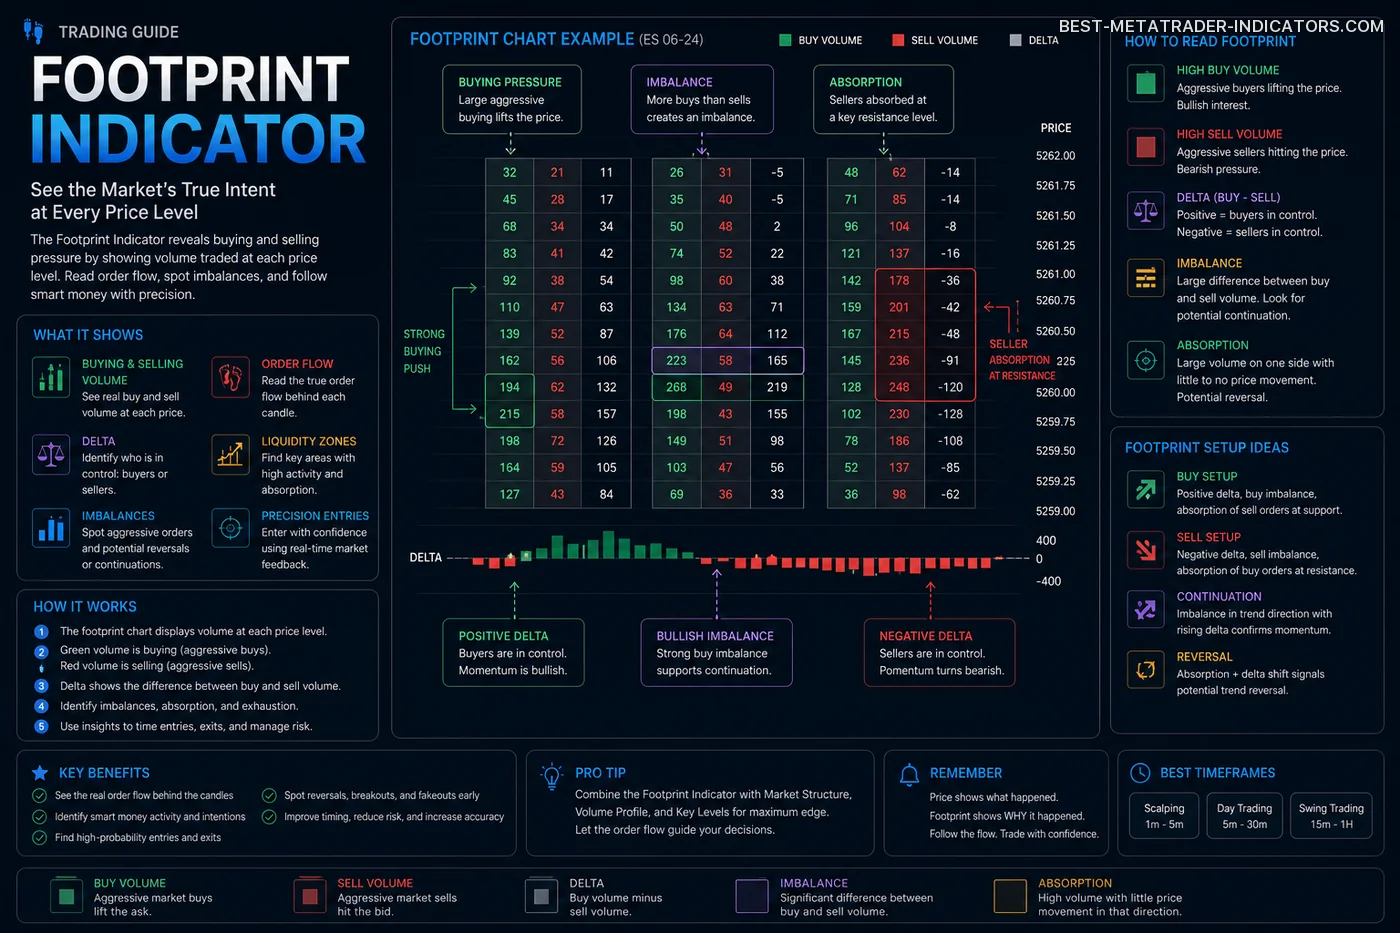
A footprint indicator is an order-flow visualization tool that displays traded volume inside each candle. Instead of seeing only the body and wick, traders can inspect the activity that took place at each price level within that candle.
Depending on the platform, a footprint chart may show bid volume, ask volume, delta, volume imbalance, point of control, unfinished auctions, stacked imbalances, and absorption zones. These details help traders judge whether buyers or sellers were truly driving a move, or whether price was simply moving through weak liquidity.
Volume at Price
Shows where the heaviest activity occurred inside a candle. This often highlights intraday support, resistance, and reaction areas that a plain candle can hide.
Delta
Measures the difference between aggressive buying and aggressive selling. Positive delta points to stronger market buying; negative delta points to stronger market selling.
Imbalance
Highlights price levels where one side of the market was clearly more aggressive than the other.
🧩 The Missing Piece Behind Cleaner Forex Entries and Exits


🔍 Why Footprint Charts Matter in Forex
Forex is decentralized, so traders do not get one single global exchange volume the way futures traders do. Many Forex traders therefore use tick volume, broker volume, futures volume, or CFD liquidity data as a proxy. It is not perfect, but when read with context, it can still provide meaningful clues.
The biggest advantage of the footprint indicator is that it stops traders from relying only on candle shape. A bullish candle can look strong while the footprint shows weak buying, trapped longs, or heavy selling absorption near the high. A bearish candle can look aggressive while the footprint shows sellers failing to push price lower.
Professional trading note: The footprint indicator is not a magic signal generator. Its value appears when it is combined with market structure, key levels, liquidity zones, session timing, and firm risk management.
📈 Key Footprint Concepts Every Trader Should Know
| Concept | Meaning | Trading Use |
|---|---|---|
| Delta | Difference between aggressive buy and sell volume. | Helps confirm momentum or identify divergence. |
| Absorption | Large aggressive orders are absorbed without price continuation. | Can indicate hidden limit orders and potential reversal zones. |
| Stacked Imbalance | Multiple imbalances appear at consecutive price levels. | Often signals strong directional pressure. |
| POC | Point of Control: the price level with the highest traded volume in a candle or session. | Useful for identifying fair value and intraday reaction zones. |
| Unfinished Auction | Price high or low forms without clear exhaustion. | May suggest the market could revisit that level. |
🧩 Footprint Indicator vs. Traditional Indicators
Footprint analysis is not a replacement for every indicator. It is best understood as a deeper view into market participation.
| Tool | Main Focus | Strength | Weakness | Best Use |
|---|---|---|---|---|
| Footprint IndicatorOrder flow tool | Volume, delta, aggression, imbalance | Shows what happened inside the candle | Can be complex for beginners | Execution, confirmation, reversal analysis |
| Moving AverageTrend indicator | Average price direction | Simple trend filter | Lags behind price | Trend context |
| RSIMomentum oscillator | Overbought and oversold conditions | Easy to read | Can stay extreme in strong trends | Divergence and momentum checks |
| Volume ProfileMarket structure tool | Volume distribution over price | Excellent for key zones | Less detailed inside individual candles | Support, resistance, value areas |
🚀 Practical Footprint Trading Strategies
Strategy 1: Absorption Reversal at Key Levels
This strategy looks for aggressive buying or selling that fails to move price further. For example, if price reaches a major resistance level and the footprint shows large buy volume at the high, but price cannot break higher, buyers may be getting absorbed by passive sellers.
- Mark a major support or resistance zone before the session starts.
- Wait for price to test that zone.
- Look for high aggressive volume without continuation.
- Enter only after price confirms rejection.
- Place the stop beyond the absorption area, not randomly inside market noise.
Risk warning: Absorption can continue longer than expected. Never short only because there is large buying at resistance or buy only because there is large selling at support. Wait for price confirmation.
Strategy 2: Stacked Imbalance Breakout
A stacked imbalance appears when buyers or sellers dominate several consecutive price levels. This can suggest real directional urgency. In breakout trading, stacked imbalances can help confirm that a move is supported by aggressive participation.
- Use this setup during liquid sessions such as London or New York.
- Focus on breakouts from well-defined consolidation zones.
- Avoid chasing the move if the candle is already extended far beyond the breakout level.
- Look for a pullback into the imbalance zone for a cleaner entry.
Strategy 3: Delta Divergence
Delta divergence happens when price makes a new high or low, but delta does not confirm the move. For example, price may print a new high while delta is weaker than before. This can suggest that the trend is losing aggressive support.
Pro idea: Delta divergence becomes more useful when it appears at a higher-timeframe supply or demand zone, previous session high or low, weekly open, daily open, or major liquidity level.
Strategy 4: Pullback into High-Volume Node
After a strong move, price often returns to areas where high volume previously traded. These high-volume nodes can act like magnets or reaction zones. A footprint chart can help determine whether the pullback is being accepted or rejected.
- If the pullback shows weak opposing delta, the trend may continue.
- If the pullback shows strong absorption against the trend, momentum may be weakening.
- If price returns to the POC and rejects quickly, continuation may be possible.
📡 Advanced Signal Intelligence for MT4 & MT5 Traders
🛠️ How to Build a Footprint-Based Trading Plan
A footprint indicator is most useful when it is part of a complete decision-making framework. The goal is not to react to every imbalance or delta shift, but to filter the most meaningful order-flow events.
Step 1: Define Context
Identify trend direction, daily range, previous highs and lows, session opens, and important support or resistance zones.
Step 2: Wait for Location
Only use footprint signals at meaningful locations. A footprint signal in the middle of nowhere usually has lower value.
Step 3: Check Timing
Order flow is more reliable during liquid trading hours. Be careful during low-liquidity periods and unusually fast volatility spikes.
Step 4: Manage Risk
Every setup needs a predefined stop, target, and invalidation point. Footprint analysis does not remove market uncertainty.
✅ Footprint Trading Checklist
Before entering a trade, ask yourself:
- Is price trading at a meaningful level?
- Does the footprint confirm or contradict the candle?
- Is delta supporting the direction of the trade?
- Is there absorption, imbalance, or trapped volume?
- Is the session liquid enough for reliable execution?
- Is my stop placed beyond a logical invalidation point?
- Is the reward-to-risk ratio acceptable?
- Am I trading the setup, or am I reacting emotionally?
💡 Advanced Tips from a Professional Trading Perspective
- Do not read footprint data in isolation. A bullish imbalance at resistance may be a breakout signal or a trap. Location decides the difference.
- Use session highs and lows. Footprint reactions around previous session extremes often provide valuable clues.
- Watch failed continuation. Strong delta with no price progress often warns that aggressive traders are being absorbed.
- Avoid over-analysis. Too much footprint detail can create hesitation. Focus on two or three repeatable patterns.
- Replay the market. Footprint trading improves fastest through chart replay and journaling, not by adding more indicators.
🧪 Example Trade Idea: EUR/USD Reversal Setup
Imagine EUR/USD rallies into a previous daily high during the London-New York overlap. Price breaks slightly above the level, triggering breakout buyers. However, the footprint shows heavy aggressive buying at the high, while price fails to continue upward. Soon after, the next candle closes back below the breakout level.
This may suggest a failed breakout and trapped longs. A trader could look for a short entry after confirmation, with a stop above the failed auction area and a first target near the previous intraday balance zone.
Important: This is not a signal to short every false breakout. It is a framework: level first, footprint clue second, price confirmation third, risk management always.
📋 Common Mistakes When Using Footprint Indicators
| Mistake | Why It Hurts Performance | Better Approach |
|---|---|---|
| Trading every imbalance | Not every imbalance is meaningful. | Only trade imbalances at important levels. |
| Ignoring market structure | Order flow without context can be misleading. | Start with trend, range, and liquidity zones. |
| Using too many settings | Complex charts create confusion. | Keep the footprint clean and repeatable. |
| Entering before confirmation | Absorption can continue for several candles. | Wait for rejection, acceptance, or structure shift. |
| Oversizing trades | Even high-quality order-flow setups fail. | Use fixed risk and respect invalidation. |
📌 Best Markets and Timeframes for Footprint Analysis
Footprint charts are especially useful in liquid, active markets. In Forex, they are often most effective on major pairs, gold, oil, and index CFDs when liquidity is strong. Very small timeframes can provide detail, but they can also increase noise. Many traders use footprint charts on 1-minute, 3-minute, 5-minute, or range-based charts for execution, while using higher timeframes for direction.
Major FX Pairs
EUR/USD, GBP/USD, USD/JPY, and USD/CAD often provide better liquidity and cleaner execution than exotic pairs.
Gold
XAU/USD can produce strong order-flow opportunities, but volatility and spread conditions must be respected.
Indices
DAX, Nasdaq, S&P 500, and Dow CFDs can work well with footprint logic during high-volume sessions.
🧭 Simple Footprint Workflow for Beginners
- Start with one instrument only.
- Mark daily high, daily low, previous session high, previous session low, and major support/resistance.
- Wait for price to reach one of those levels.
- Look for absorption, delta divergence, or stacked imbalance.
- Wait for price confirmation before entering.
- Journal every trade with screenshots of the footprint.
- Review at least 30 examples before increasing risk.
🚀 Advanced Forex Tools for Traders Who Want an Edge
❓ Footprint Indicator FAQ
Is the footprint indicator good for Forex?
Yes, but with limitations. Since spot Forex has no centralized exchange volume, traders should understand whether their platform uses broker volume, tick volume, futures data, or CFD data.
Can beginners use footprint charts?
Beginners can use them, but they should start slowly. Focus first on basic concepts such as delta, volume at price, absorption, and imbalance.
Is footprint better than candlestick trading?
It is not automatically better. Candlesticks show structure, while footprint charts show participation inside the candle. Together, they can be more powerful.
What is the best footprint strategy?
There is no single best strategy. Many traders focus on absorption reversals, delta divergence, stacked imbalance breakouts, and pullbacks into high-volume zones.
Does footprint trading work during fast volatility?
It can show extreme order-flow activity, but execution risk is much higher. Spreads, slippage, and sudden movement can make impulsive entries dangerous.
Which settings should I use?
Use simple settings first: bid/ask volume, delta, imbalance highlights, and point of control. Add complexity only when it improves decisions.
🏁 Final Thoughts
The footprint indicator gives Forex traders a deeper view of market behavior. It helps answer questions that normal candles leave open: who was aggressive, where volume appeared, whether price accepted or rejected a level, and whether buyers or sellers were trapped.
Still, the tool is only as useful as the trader reading it. The best results come from combining footprint data with clean market structure, disciplined risk management, session awareness, and a repeatable trading plan.
In professional trading, the goal is not to know everything. The goal is to recognize high-quality situations, define the risk before entry, and execute consistently.
Disclaimer: This article is for educational purposes only and does not constitute financial advice. Trading Forex, CFDs, and other leveraged products involves risk, including the possible loss of capital. Always use a defined Stop Loss, plan your Take Profit levels in advance, and trade only with risk you can afford to manage responsibly.
📌 More Free Indicators and Trading Systems for MT4 or MT5
- Top-Rated MetaTrader Indicators


- MMLevels VG Indicator

- Profitable Forex Indicator:…

- Trend Reversal Indicator…

- Atr Levels Lnx One Indicator

- Mastering RSI in Forex…

- The Hidden MACD Indicator…

- The Smart Money Indicator…

- Best Hedge Fund Indicator…

- How Smart Traders Use the Fair…

- Key Levels Indicator

- Trend Levels VRD Indicator

- RSI HMA Min Max Levels MTF Indicator

- Automatic Fibonacci Levels Indicator

- CCI Min Max Levels MTF Indicator

- All Time Pivot Hilo Atr Cam…

- WPR Up Down Levels Indicator

- Auto Pivot Plotter Mid Levels…

- Fractal Trading Levels Indicator

- CCI Average Floating Levels Indicator

- Acd Pv Levels Indicator

- Premium Indicators for MT4 and MT5