A liquidity indicator is more than another chart overlay. It acts like a market-reading assistant, helping you understand where larger participants may be searching for orders before price commits to its real move.
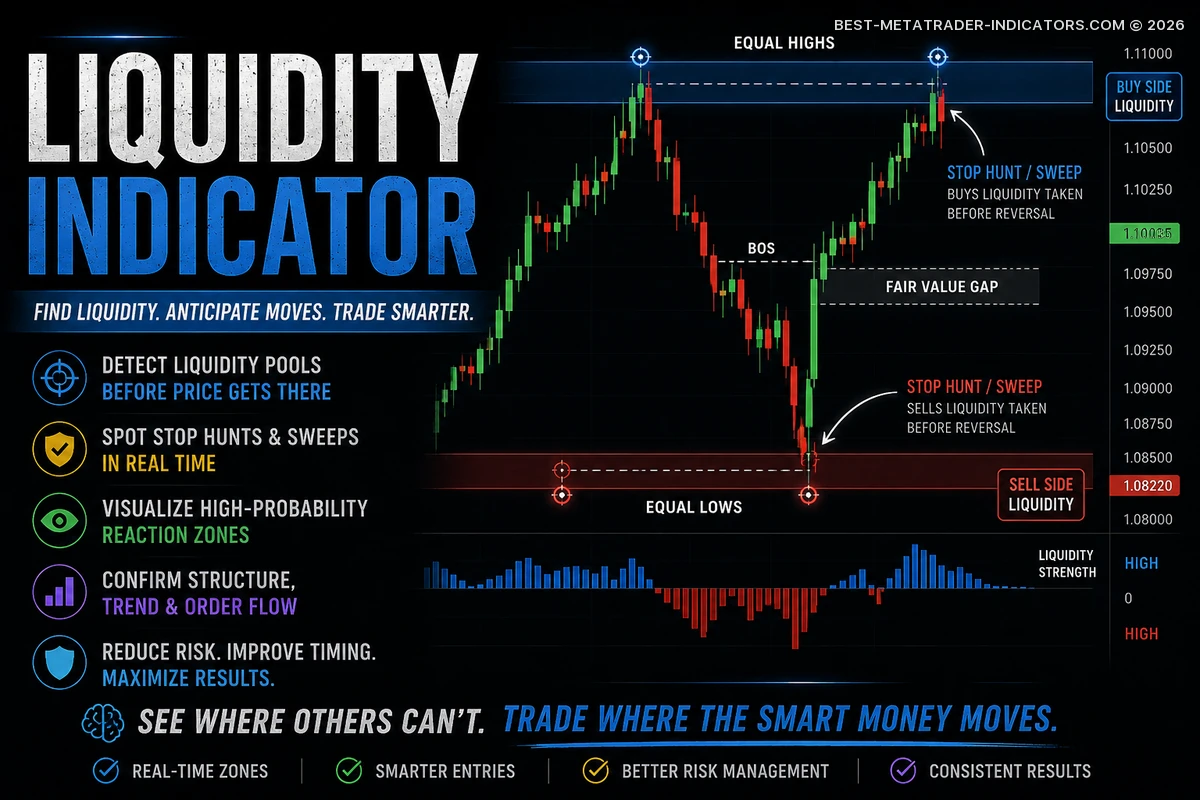
In Forex trading, liquidity often rests above old highs, below old lows, around equal highs and lows, near session extremes, and close to obvious support and resistance areas. When price suddenly spikes into those areas and rejects, traders often call it a liquidity grab, stop hunt, or sweep.
This guide explains how liquidity indicators work, how traders use them, what signals deserve attention, and how to build smarter trading strategies around liquidity zones without blindly chasing every spike.
💧 What Is a Liquidity Indicator?
A liquidity indicator is a technical tool designed to highlight areas where market orders, stop losses, pending orders, or high trading interest may be concentrated. Instead of only showing trend direction, it attempts to reveal where price may search for liquidity before continuing, reversing, or expanding into the next structure point.
Many retail traders focus only on classic support and resistance. More experienced traders usually ask a sharper question: Where are the orders? A liquidity indicator helps answer that question by marking possible liquidity pools on the chart.
🧠 Trader’s Note
Liquidity never means that price must reverse. It means price may react because a meaningful cluster of orders could be sitting in that area. The reaction can be a reversal, continuation, fakeout, breakout, or consolidation.
👀 What Are Pro Traders Seeing That You’re Missing?


📌 Why Liquidity Matters in Forex Trading
The Forex market moves when orders are triggered and matched. Larger participants need liquidity to enter, reduce, or exit positions without excessive slippage. They cannot always execute size cleanly in the middle of an empty chart. They often need price to travel into areas where enough opposite-side orders are available.
This is why price often moves toward obvious highs and lows. Those levels attract stop losses, breakout orders, and pending entries. Once those orders are triggered, price may reverse, accelerate, or expand toward the next visible liquidity target.
🎯 Stop Loss Pools
Stops often sit above swing highs and below swing lows. A liquidity indicator can help mark those areas before price reaches them.
⚡ Breakout Traps
Liquidity sweeps can trigger breakout traders into weak positions before the market moves in the opposite direction.
📍 Smart Zones
Liquidity areas can become powerful reaction zones when combined with trend, structure, session timing, or confirmation signals.
🔍 Common Liquidity Zones on a Forex Chart
Liquidity is rarely random. It often appears around chart levels that most traders can see. A good liquidity indicator tries to detect these zones automatically and present them clearly on the chart.
| Liquidity Zone | Why It Matters | Possible Trader Reaction |
|---|---|---|
| Equal highs | Buy stops and breakout entries may sit above the level. | Watch for sweep and bearish rejection. |
| Equal lows | Sell stops and breakdown entries may sit below the level. | Watch for sweep and bullish rejection. |
| Previous day high/low | Intraday traders often place stops around these levels. | Useful for London and New York session setups. |
| Session highs/lows | Asian, London, and New York ranges often create liquidity targets. | Look for range sweep and continuation or reversal. |
| Major swing points | Obvious market structure levels attract stop orders. | Combine with trend and candle confirmation. |
| Round numbers | Psychological levels attract pending orders. | Use extra confirmation before entry. |
📊 How a Liquidity Indicator Usually Works
Different liquidity indicators are built with different logic. Some are simple and mark equal highs and lows. Others detect stop hunt candles, fair value gaps, volume spikes, order blocks, market structure shifts, or session liquidity levels.
The strongest approach is not to treat the indicator as a magic buy or sell signal. Instead, use it as a map of areas where price may react once structure and timing agree.
- Identify liquidity pools: The indicator marks possible stop areas above highs or below lows.
- Wait for price to reach the zone: Avoid entering early just because a level has appeared on the chart.
- Watch the reaction: Look for rejection candles, displacement, engulfing candles, or market structure shift.
- Confirm direction: Enter only when price shows that liquidity has been taken and momentum has started to shift.
- Manage risk: Place the stop beyond the sweep or invalidation point, not randomly in the middle of the move.
⚠️ Important Warning
A liquidity indicator can show where price may react, but it cannot guarantee that a clean reaction will follow. Liquidity can be swept and price can still continue strongly in the same direction. Always use risk management.
🧩 Liquidity Indicator vs Support and Resistance
Liquidity trading and support/resistance trading are related, but they are not the same. Support and resistance focus on where price reacted in the past. Liquidity analysis focuses on where orders are likely waiting now, especially around levels that look obvious to most traders.
Liquidity Indicator vs Classic Support and Resistance
Both can be useful, but liquidity gives a deeper view of why price may run through a level before reversing.
| Method | Main Focus | Strength | Weakness |
|---|---|---|---|
| Support and ResistanceTraditional price reaction zones | Historical levels where price bounced or rejected. | Simple, clear, and beginner-friendly. | Can fail during stop hunts and fake breakouts. |
| Liquidity IndicatorOrder concentration zones | Areas where stops, breakout orders, and trapped traders may sit. | Useful for spotting sweeps, traps, and reversal setups. | Needs confirmation and context to avoid false signals. |
| Volume IndicatorActivity and participation | Measures trading activity or tick volume. | Can confirm strong moves or exhaustion. | Forex volume is usually broker-based, not centralized. |
🚀 Strategy 1: Liquidity Sweep Reversal Setup
This is one of the most popular ways to use a liquidity indicator. The goal is to wait for price to take liquidity above a high or below a low, then enter only after confirmation that the move was likely a trap.
✅ Basic Rules
- Mark a clear liquidity level above equal highs or below equal lows.
- Wait for price to sweep the level with a strong wick or fast spike.
- Look for rejection, engulfing candle, or market structure shift.
- Enter after confirmation, not during the first emotional spike.
- Place the stop beyond the liquidity sweep.
- Target the opposite side of the range or the next liquidity pool.
Example: EUR/USD forms equal highs during the London session. Price breaks above them, triggers breakout buyers, then closes back below the level with a bearish rejection candle. A trader may then look for a short entry after lower-timeframe confirmation and a clear invalidation point.
📉 Strategy 2: Liquidity Grab With Trend Continuation
Not every liquidity grab becomes a reversal. Sometimes price sweeps liquidity against the trend, collects orders, and then continues with the main trend. This setup can be powerful when it aligns with higher-timeframe direction and clean market structure.
📈 Bullish Continuation
In an uptrend, price may sweep a recent low, trap sellers, and then continue higher. Look for bullish displacement after the sweep.
📉 Bearish Continuation
In a downtrend, price may sweep a recent high, trap buyers, and then continue lower. Look for bearish displacement after the sweep.
This strategy works best when the higher timeframe has a clean directional bias. If the market is choppy, liquidity sweeps can happen on both sides and create confusion.
⏰ Strategy 3: Session Liquidity Trading
Forex liquidity shifts throughout the trading day. The London and New York sessions often create strong movements, especially around previous session highs and lows. A liquidity indicator that marks session ranges can help traders prepare before volatility expands and emotional entries begin.
| Session Level | How Traders Use It | Confirmation Idea |
|---|---|---|
| Asian high | Potential buy-side liquidity target during London open. | Watch for sweep and rejection or breakout continuation. |
| Asian low | Potential sell-side liquidity target during London open. | Look for wick rejection and structure shift. |
| London high | Possible target or reversal zone during New York session. | Combine with session context and market structure. |
| London low | Possible sell-side liquidity area before a New York reversal. | Wait for strong candle confirmation. |
🎯 Professional MT4 & MT5 Indicators with Accurate Signals
🛠️ Best Settings for a Liquidity Indicator
The best settings depend on your trading style, timeframe, and tolerance for noise. Scalpers usually need more sensitive settings, while swing traders often prefer cleaner higher-timeframe liquidity zones.
⚡ Scalping
- Timeframes: M1 to M15
- Focus: session highs/lows
- Risk: very tight but precise
📊 Day Trading
- Timeframes: M15 to H1
- Focus: intraday liquidity pools
- Risk: moderate and structured
🕰️ Swing Trading
- Timeframes: H4 to Daily
- Focus: major highs and lows
- Risk: wider but cleaner setups
✅ Liquidity Trading Checklist
Before entering a trade based on a liquidity indicator, run through this checklist with discipline. It can keep you away from emotional entries and low-quality trades that only look good after the move has already started.
📋 Pre-Trade Checklist
- Is there a clear liquidity level on the chart?
- Is price moving into a logical area, not random noise?
- Has liquidity actually been swept?
- Is there a candle rejection or displacement after the sweep?
- Does the setup match the higher-timeframe direction or structure context?
- Is the stop loss placed beyond the invalidation level?
- Is the risk-to-reward ratio at least reasonable?
- Is there unusual volatility nearby that could distort the setup?
❌ Common Mistakes When Using Liquidity Indicators
Liquidity indicators are powerful, but many traders use them the wrong way. The biggest mistake is entering too early simply because a zone appears on the chart and looks tempting.
🚫 Mistake 1: Trading Every Liquidity Zone
Not every liquidity area is worth trading. Focus on clean levels, session timing, and strong confirmation.
🚫 Mistake 2: Ignoring Market Structure
A sweep means little if market structure does not support the trade idea. Always check trend, swing direction, and the latest structure break.
🚫 Mistake 3: Entering Before the Sweep
Guessing the sweep is dangerous. Wait until liquidity is taken and price shows a reaction.
🚫 Mistake 4: Using Random Stops
Your stop loss should be placed beyond the liquidity event or invalidation point, not where it feels emotionally comfortable.
🧠 Pro Tips for Better Liquidity Indicator Signals
- Use higher-timeframe context: A liquidity sweep on M5 is stronger when it happens at an H1 or H4 level.
- Watch candle closes: A wick through liquidity with a close back inside the range can signal rejection.
- Combine with displacement: Strong candles after a sweep often show that real momentum has entered.
- Avoid messy ranges: If liquidity is everywhere, the chart is probably too noisy.
- Respect volatility: Liquidity sweeps during unstable volatility can be violent and unpredictable.
- Track screenshots: Save examples of successful and failed sweeps to build pattern recognition.
💡 Practical Tip
The best liquidity trades often feel uncomfortable at first. Price may break an obvious level, convince most traders that a breakout is underway, and only then reverse. Patience is the edge.
📍 Best Currency Pairs for Liquidity Indicator Trading
Liquidity strategies can work on many Forex pairs, but they are usually cleaner on major pairs because spreads are tighter and participation is deeper.
| Pair Type | Examples | Liquidity Trading Quality |
|---|---|---|
| Major pairs | EUR/USD, GBP/USD, USD/JPY | Usually cleanest for intraday liquidity strategies. |
| Minor pairs | EUR/GBP, EUR/JPY, GBP/JPY | Can be strong but may require wider stops. |
| Exotic pairs | USD/TRY, EUR/ZAR, USD/MXN | Higher spreads and volatility can make signals less reliable. |
| Gold | XAU/USD | Very popular for liquidity sweeps, but risk can be much higher. |
⚖️ Pros and Cons of a Liquidity Indicator
✅ Pros
- Helps identify stop hunt zones.
- Improves understanding of market structure.
- Can filter weak breakout trades.
- Works well with session trading.
- Useful for reversal and continuation setups.
⚠️ Cons
- Can create false expectations without confirmation.
- May be confusing for complete beginners.
- Does not predict sudden volatility shocks.
- Requires strong risk management.
- Signals can become messy in sideways markets.
📈 Example Liquidity Indicator Trading Plan
A trading plan keeps liquidity analysis practical and repeatable. Without rules, traders may start seeing liquidity everywhere and overtrade weak setups.
📝 Simple Trading Plan
- Trade only EUR/USD, GBP/USD, or XAU/USD.
- Use H1 to define the main trend and important highs/lows.
- Use M15 or M5 to wait for a liquidity sweep.
- Enter only after rejection and structure confirmation.
- Risk no more than 1% per trade.
- Take partial profit at the nearest internal liquidity level when price reacts cleanly.
- Move stop loss only after price confirms continuation.
- Stop trading after two losses in one session.
📈 Better Signals. Faster Decisions. Stronger Trades.
❓ Liquidity Indicator FAQ
What does a liquidity indicator show?
It shows possible areas where stop losses, pending orders, breakout orders, or strong trading interest may be located.
Is a liquidity indicator good for beginners?
Yes, but beginners should first understand market structure, support and resistance, and risk management before relying on liquidity zones.
Can liquidity indicators repaint?
Some indicators may adjust levels as new candles form, especially when swing points are still developing. Always test the tool in live market conditions and check how it behaves in real time.
Which timeframe is best?
M15, H1, and H4 are often cleaner than very low timeframes. Scalpers may use M1 or M5, but false signals can increase.
Does liquidity trading work with gold?
Yes, XAU/USD often reacts strongly around liquidity zones, but its volatility can be aggressive. Position size must be controlled carefully.
Should I trade every liquidity sweep?
No. The best setups usually include context, timing, rejection, confirmation, and a clear risk-to-reward structure before entry.
🏁 Final Thoughts: Is a Liquidity Indicator Worth Using?
A liquidity indicator can be a valuable tool for Forex traders who want to read the market beyond basic buy and sell signals. It helps you see where stops may be hiding, where fakeouts may develop, and where price may search for orders before the next important move.
The real edge comes from combining liquidity with market structure, session timing, candle confirmation, and disciplined risk management. Used correctly, a liquidity indicator can help you avoid obvious traps and wait for cleaner, better-structured trading opportunities.
The goal is simple: stop reacting like trapped liquidity and start thinking like a trader who understands where liquidity is likely to be taken next.
Risk Disclaimer: Trading Forex, CFDs, and leveraged products involves a high level of risk and may not be suitable for every trader. A liquidity indicator can support technical analysis, but it cannot remove uncertainty or guarantee profitable results. Always use a defined stop loss, control position size, and trade only with capital you can afford to lose.
📌 Great Indicators and Trading Systems for MT4 or MT5
- Top-Rated MetaTrader Indicators


- Balance Volume Histogram Mtf…

- Uni Volume Delta Indicator

- Market Profile with Trend…

- Volume Profile Indicator for MT5

- Atr Levels Volume Indicator

- OHLC Volume Histogram Indicator

- Cumulative Volume Indicator

- Enhanced Balance Volume Indicator

- Trade Volume Index Indicator

- Market Volume Profile…

- Horizontal Volume Indicator

- Better Volume Chart Bars Indicator

- Balance Volume Bands Arrow Indicator

- Volume Indicator for MT5

- Volume adjusted RSI Indicator

- Buys Sells Volumes Indicator

- Balance Volume Gadi Custom…

- Better Volume No Colors Indicator

- Better Volume Cdrw Alert Indicator

- Better Volume Ticks Indicator

- Premium Indicators for MT4 and MT5