Submit your review | |
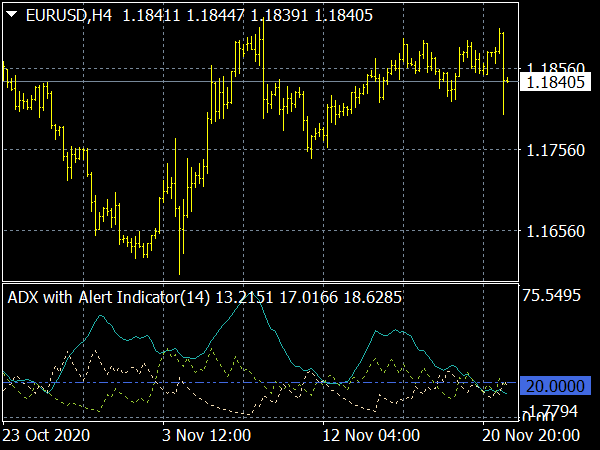
It should always be noted that the ADX measures the trend, so its rise means a trend or an increasing trend, the fall means a decreasing trend. This is regardless of which direction the trend is going, so the ADX is also rising in the bear trend. If the ADX has risen above 40 and then forms a top, it indicates the end of the current trend. This does not have to be a countertrend, it is often a sideways movement.
On the other hand, entering the range of over 45 or even over 50 means that the previous trend will accelerate again in the short term. This can be used well for short-term trading. If the ADX moves towards 10 or stays there for a longer time, a larger movement is imminent. This is one of the most important interpretation options of the ADX, for some markets you can already take 15 or even 20, you always have to carry out the concrete zone analysis.
It is important that a longer sideways movement has taken place before a signal, i.e. when leaving this low range upwards, whereby this longer can of course be seen in the chart relative to the time frame used. Since the oscillators in the trend remain in the extreme range for a very long time, the ADX indicates the time when signals from the oscillators are relevant.
So you should not use the oscillators when the ADX is rising, only when the ADX is falling. One of the most important applications is in the field of writing options. One takes advantage of the fact that a turn in the high range of the ADX is by no means always followed by a trend sequence, but almost always a consolidation phase and a sideways movement is enough for the option writer to make a profit.
The traditional application, which consists in avoiding values below 25, is wrong. The big trends develop when the ADX is very low near 10 or even lower and then turns upwards. If he reaches 25, then usually too much of the movement is already over. In day trading, sideways movements are usually characterized by a falling ADX. In general, the ADX works very well even in small periods up to 5-minute charts.
Typical false signals in the ADX
The indicator only gives false signals for top tops and bottoms. The ADX then still falls, although a strong countertrend has already set in, as +DM and -DM neutralize each other. It may be that the movement has already started a long time ago, when the ADX suddenly rises sharply and suggests a new trend.
Filtering of breaks
Most bull and bear traps, i.e. breakouts above resistance and support lines, as well as trend lines that fail, take place with a falling ADX. Therefore, you can filter out the majority of these false breaks, the whole thing works especially well with day trading, e.g. with an ADX for 13 bars.
Filtering indicators with the ADX
Trend followers work with rising ADX, oscillators work with falling ADX. It depends above all on the angle of inclination of the ADX, less on its absolute height. As long as the ADX is rising, only the signals that run in the direction of the trend are used by the oscillators.
📌 Great Indicators and Trading Systems for MT4 or MT5
- Top-Rated MetaTrader Indicators


- Adx Standart Deviation Indicator

- Adx Smoothed Rosh Alert Indicator

- Wilders Adx Alert Indicator

- Adx Wma Bands Indicator

- MTH ADX SMA Cross System

- ADX Stochastic with Alert Indicator

- ADX Alert Play Blue Indicator

- Adx Cross Alert Email Indicator

- ADX Magic System

- Adx Close Test Indicator

- Adx Fibonacci Ma Indicator

- ADX Crossing Alert Email

- Adaptive Adx Indicator

- Adx Directional Movement Indicator

- ADX Wilders DMI with Alerts Indicator

- ADX Cross Arrows Alerts MTF

- Adx Don Histogram Indicator

- ADX MTF Trend Signal Indicator

- Adx Wilders Book V2 Indicator

- ADX MA Indicator

- Non-Repainting Non-Lagging Indicators