A price action indicator is not just another tool dropped onto a chart. Used well, it becomes a practical way to read market behavior, define high-probability zones, and stop reacting emotionally to every candle. After more than two decades of watching currency pairs move through trends, ranges, false breaks, liquidity sweeps, and impatient retail entries, one lesson still stands: price itself is the first indicator.
In this guide, we will walk through what price action indicators are, how they work on MetaTrader-style charts, which strategies traders can build around them, and how to combine them with stop loss, take profit, trading psychology, and professional risk management.
🧭 What Is a Price Action Indicator?
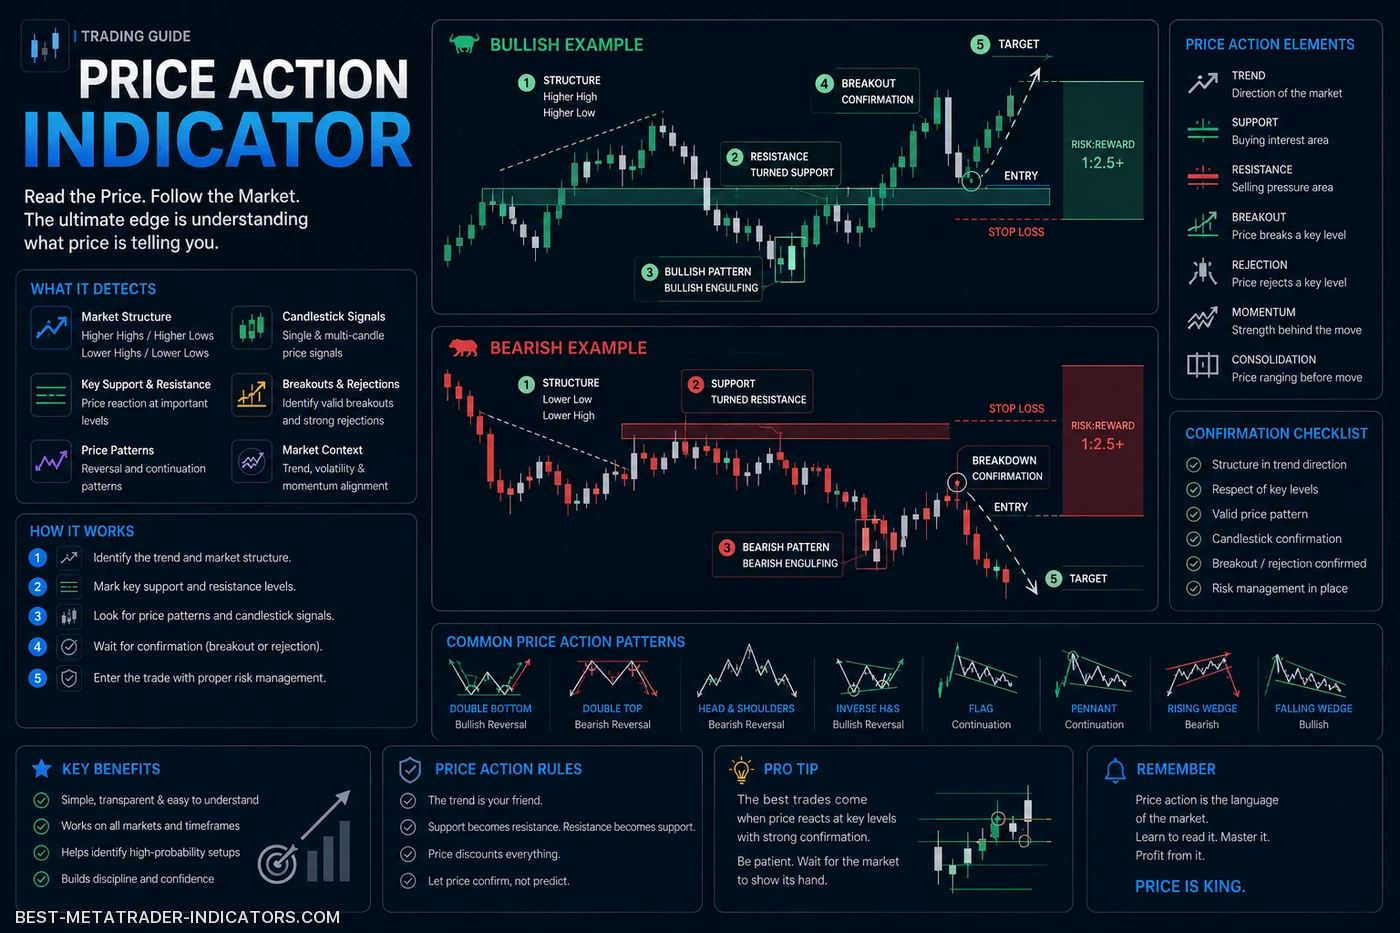
A price action indicator is a technical trading tool that helps traders interpret market movement directly from price data. Instead of depending only on delayed calculations, it focuses on candlesticks, highs, lows, support and resistance, volatility, momentum, breakouts, pullbacks, and market structure.
Classic price action traders often say they trade a “naked chart.” In practice, many modern Forex traders still use indicators that make price action easier to read. A clean swing-high/swing-low indicator, a support and resistance marker, or a candlestick-pattern tool can speed up analysis without replacing it.
Professional note: The best price action indicator does not tell you what to do. It helps you see what the market is already doing, so your trade plan is based on structure rather than impulse.
🔍 Why Price Action Matters in Forex Trading
The Forex market rewards traders who can read structure, timing, momentum, and risk. Retail traders cannot see every order behind the move, but price action still leaves clues around swing points, rejected levels, failed breakouts, and candle closes. Those clues help identify where buyers and sellers are likely defending a zone.
Structure
Price action shows whether the market is trending, ranging, reversing, or consolidating. That context decides whether you should look for continuation, rejection, or no trade at all.
Timing
It helps traders identify cleaner entries instead of chasing candles after the move is already stretched and the stop loss has become uncomfortable.
Risk
Clear highs, lows, and zones allow more logical stop-loss placement and better take-profit planning, especially when risk-to-reward must be defined before entry.
🧱 Core Elements of Price Action Indicators
Most price action indicators are built around a few key market concepts. Understanding these foundations matters far more than downloading a folder full of tools and hoping one of them will solve execution problems.
- Support and resistance: Areas where price has reacted before and where traders often plan entries, exits, stops, and take-profit zones.
- Swing highs and swing lows: Turning points that define whether market structure is building strength, losing momentum, or preparing to reverse.
- Trend direction: Higher highs and higher lows indicate an uptrend; lower highs and lower lows indicate a downtrend.
- Candlestick patterns: Pin bars, engulfing candles, inside bars, rejection wicks, and momentum candles that show pressure at specific levels.
- Breakouts and retests: Price leaving a range and returning to test the broken level before continuation or failure.
- Volatility expansion: When quiet markets suddenly begin to move with larger candles, wider stops, and faster decision points.
🧰 Popular Types of Price Action Indicators
Different indicators highlight different parts of price behavior. The best choice depends on your trading style, timeframe, and level of discretion.
| Indicator Type | What It Shows | Best Use | Trader Rating |
|---|---|---|---|
| Support & Resistance IndicatorKey market reaction zones | Horizontal levels, supply and demand areas, previous highs and lows | Planning entries, exits, stop-loss levels, and take-profit zones | ★★★★★ |
| Swing High/Low IndicatorMarket structure | Local turning points and trend sequence | Trend trading, pullback entries, and reversal identification | ★★★★★ |
| Candlestick Pattern IndicatorPrice rejection and momentum | Pin bars, engulfing candles, inside bars, doji candles | Entry confirmation near important zones | ★★★★☆ |
| Breakout IndicatorRange expansion | Breaks of consolidation, trendline breaks, range exits | Momentum trading and retest-based continuation setups | ★★★★☆ |
| ATR-Based Price Action ToolVolatility context | Average candle movement and volatility expansion | Stop-loss distance, take-profit planning, and position sizing | ★★★★☆ |
⚙️ How to Use a Price Action Indicator Correctly
The mistake many traders make is expecting an indicator to produce automatic buy and sell signals. A price action indicator should be used as a decision-support tool, not as a substitute for reading the chart. On MetaTrader 4 or MetaTrader 5, that means the indicator should support your technical plan, not become the plan.
- Start with the higher timeframe. Identify the dominant trend or range on the daily, 4-hour, or 1-hour chart.
- Mark important zones. Focus on clean support, resistance, supply, demand, and previous swing points.
- Wait for price to reach the zone. Do not trade in the middle of nowhere, where stop placement is usually random.
- Look for confirmation. Use rejection candles, engulfing patterns, failed breakouts, or retests.
- Define risk before entry. Your stop-loss must make sense structurally, not emotionally.
- Manage the trade. Take partial profits, trail stops, or exit when price action changes.
Warning: A price action indicator can repaint, misread weak zones, or generate signals in thin conditions. Always test the tool in a demo account, use historical replay where possible, and check how signals behave after candles close.
📌 Strategy 1: Support and Resistance Rejection
This is one of the most reliable and timeless Forex strategies. The idea is simple: wait for price to reach a significant level, then look for signs that the market is rejecting that area. The setup is strongest when the candle close confirms the rejection and the stop-loss level is clear before the trade is opened.
Bullish Setup
- Price reaches a support zone.
- A long lower wick appears.
- The candle closes back above support.
- Entry is considered after confirmation.
- Stop-loss goes below the rejection low.
Bearish Setup
- Price reaches a resistance zone.
- A long upper wick appears.
- The candle closes back below resistance.
- Entry is considered after confirmation.
- Stop-loss goes above the rejection high.
🚀 Strategy 2: Breakout and Retest
Breakouts attract many traders, but chasing the first candle often leads to poor entries. A more professional approach is to wait for the breakout, then trade the retest. This gives the market time to prove whether the broken level has truly changed role.
Example: EUR/USD breaks above a resistance level with a strong candle. Instead of buying immediately, the trader waits for price to return to the broken resistance. If that level now acts as support and the candle close confirms demand, a long setup may form with the stop placed below the retest low.
Breakout Retest Checklist
- The breakout candle should close clearly beyond the level.
- Volatility should expand compared with the previous candles on your platform.
- The retest should not immediately collapse back into the range.
- The entry should offer at least a reasonable risk-to-reward ratio.
- A failed retest is not a signal to hope. It is a signal to step away.
📉 Strategy 3: Trend Continuation with Pullbacks
Strong trends rarely move in a straight line. They advance, pause, pull back, and continue. A price action indicator that identifies swing highs and lows can help traders avoid countertrend traps and focus on entries that follow the dominant structure.
| Market Condition | Price Action Clue | Trading Idea |
|---|---|---|
| Uptrend | Higher highs and higher lows | Buy pullbacks into support or rising structure |
| Downtrend | Lower highs and lower lows | Sell rallies into resistance |
| Range | Repeated rejection at top and bottom | Trade extremes, avoid the middle |
| Transition | Structure breaks and failed retests | Wait for confirmation before switching bias |
🧠 Professional Trading Ideas
Price action becomes powerful when it is combined with context. Here are practical ideas that experienced traders use regularly when building setups, filtering weak signals, and protecting capital.
Session Awareness
Different trading sessions have different behavior. Some periods produce cleaner continuation; others create slow ranges. A breakout during active liquidity is usually more meaningful than a breakout during a quiet, narrow session.
Trade Filter
Not every technical signal deserves execution. If the setup forms far from structure, offers a poor stop-loss position, or leaves no realistic take-profit target, the best trade is often no trade.
Multi-Timeframe Confirmation
A 15-minute signal is stronger when it aligns with a 1-hour or 4-hour zone. The higher timeframe gives direction; the lower timeframe gives precision.
Liquidity Thinking
Price often moves beyond obvious highs and lows before reversing. Stop hunts are common around clean levels. Wait for the close, not only the wick.
✅ Price Action Indicator Checklist
Before taking a trade based on a price action indicator, run through this checklist. A checklist does not make trading mechanical, but it slows the trader down enough to avoid impulsive entries.
- Is the market trending, ranging, or transitioning?
- Is the signal forming at a meaningful level?
- Does the higher timeframe support the idea?
- Is the stop-loss placed beyond a logical structure point?
- Is the risk-to-reward ratio acceptable?
- Is the take-profit target based on structure rather than wishful thinking?
- Is the trade part of a tested plan?
- Can you accept the loss without emotional reaction?
⚖️ Price Action Indicator vs Traditional Technical Indicators
Both approaches can work, but they serve different purposes. Traditional indicators often calculate information from past price data, while price action analysis focuses on the raw behavior of the market. Many MetaTrader traders use both: price action for structure and a simple indicator layer for confirmation.
A practical comparison for Forex traders deciding how to build a clean, usable chart setup.
| Category | Price Action Indicator | Traditional Indicator |
|---|---|---|
| Focus | Market structure, candles, zones, breakouts | Mathematical formulas based on price or tick movement |
| Speed | Often more responsive to current market behavior | Can lag because many indicators use averages |
| Best For | Discretionary traders, structure traders, clean chart users | System traders, signal filters, trend confirmation |
| Main Risk | Subjective interpretation | False confidence from mechanical signals |
| Professional Use | Decision framework | Confirmation layer |
💡 Tips from a 20-Year Forex Perspective
- Trade fewer setups. Quality beats frequency in Forex.
- Avoid messy charts. Too many tools create conflicting signals.
- Respect the candle close. The close often reveals whether rejection was real or just noise.
- Do not fight strong momentum. A reversal signal against a powerful trend needs extra confirmation.
- Journal every trade. Screenshots before and after the trade are more valuable than memory.
- Master one pair first. EUR/USD, GBP/USD, USD/JPY, and XAU/USD all have different personalities.
- Think in probabilities. No indicator wins all the time. Your edge plays out over a series of trades.
Risk reminder: Forex trading involves significant risk. A price action indicator can improve structure and discipline, but it cannot remove uncertainty. Always use position sizing, define the stop loss before entry, and never risk money you cannot afford to lose.
🛠️ Common Mistakes to Avoid
Chasing Signals
Entering after a large candle often creates poor risk-to-reward and emotional trade management. By the time the trader enters, the best part of the move may already be gone.
Ignoring Context
A bullish candle in the middle of a downtrend is not automatically a buying opportunity. Context decides whether the candle is meaningful or just a temporary pause.
Moving Stops
If the trade idea is invalidated, accept the loss. Moving the stop usually turns a small controlled loss into a larger emotional one.
📋 Simple Price Action Trading Plan
Here is a simple framework that can be adapted to different Forex pairs and timeframes. It works best when the trader keeps the process repeatable and avoids changing rules after every losing trade.
| Step | Action | Purpose |
|---|---|---|
| 1 | Check daily and 4-hour market structure | Define directional bias |
| 2 | Mark support, resistance, and liquidity zones | Find high-interest areas |
| 3 | Wait for price to reach a zone | Avoid random entries |
| 4 | Look for rejection, breakout, or retest | Confirm trade idea |
| 5 | Calculate position size | Control risk |
| 6 | Review the trade after exit | Improve future decisions |
❓ Price Action Indicator FAQ
What is the best price action indicator?
The best one is usually the tool that helps you identify structure, support and resistance, and clean entry zones without cluttering the chart.
Can beginners use price action indicators?
Yes, but beginners should first learn basic market structure, candlestick behavior, stop-loss placement, and position sizing before relying on any indicator.
Do price action indicators repaint?
Some tools can repaint, especially swing or pattern indicators that adjust as new candles form. Always test the indicator in live market replay.
Is price action better than indicators?
Price action is often more direct, but traditional indicators can still be useful as filters. Many professional traders combine both.
Which timeframe works best?
The 4-hour and daily charts are excellent for structure. Lower timeframes such as 15-minute or 5-minute charts can help refine entries.
Can it make trading profitable?
No indicator guarantees profit. Profitability depends on strategy, discipline, risk control, execution, and emotional consistency.
🏁 Final Thoughts
A price action indicator can be a valuable tool for Forex traders, but it should never become a shortcut for thinking. The real edge comes from understanding market structure, waiting for quality zones, managing risk, and staying consistent over many trades.
For serious traders, price action is not about predicting every move. It is about reading the market clearly enough to make disciplined decisions when probability is on your side.
Disclaimer: This article is for educational purposes only and does not constitute financial advice, investment advice, or a trading recommendation. Forex and CFD trading involve substantial risk. Always trade with a tested plan, appropriate position sizing, and a predefined stop loss.