The smart money indicator is not a magic button, a guaranteed signal, or a shortcut to instant profits. In serious Forex trading, it works best as a structured way to identify where larger participants may be accumulating, distributing, trapping late entries, or repricing liquidity.
After more than two decades around currency charts, one lesson still holds: price does not simply wander around retail indicators. It moves toward liquidity, reacts around imbalance, and often punishes the most obvious positioning. A useful smart money indicator should make that logic easier to read without taking the decision out of your hands.
🧠 What Is a Smart Money Indicator?
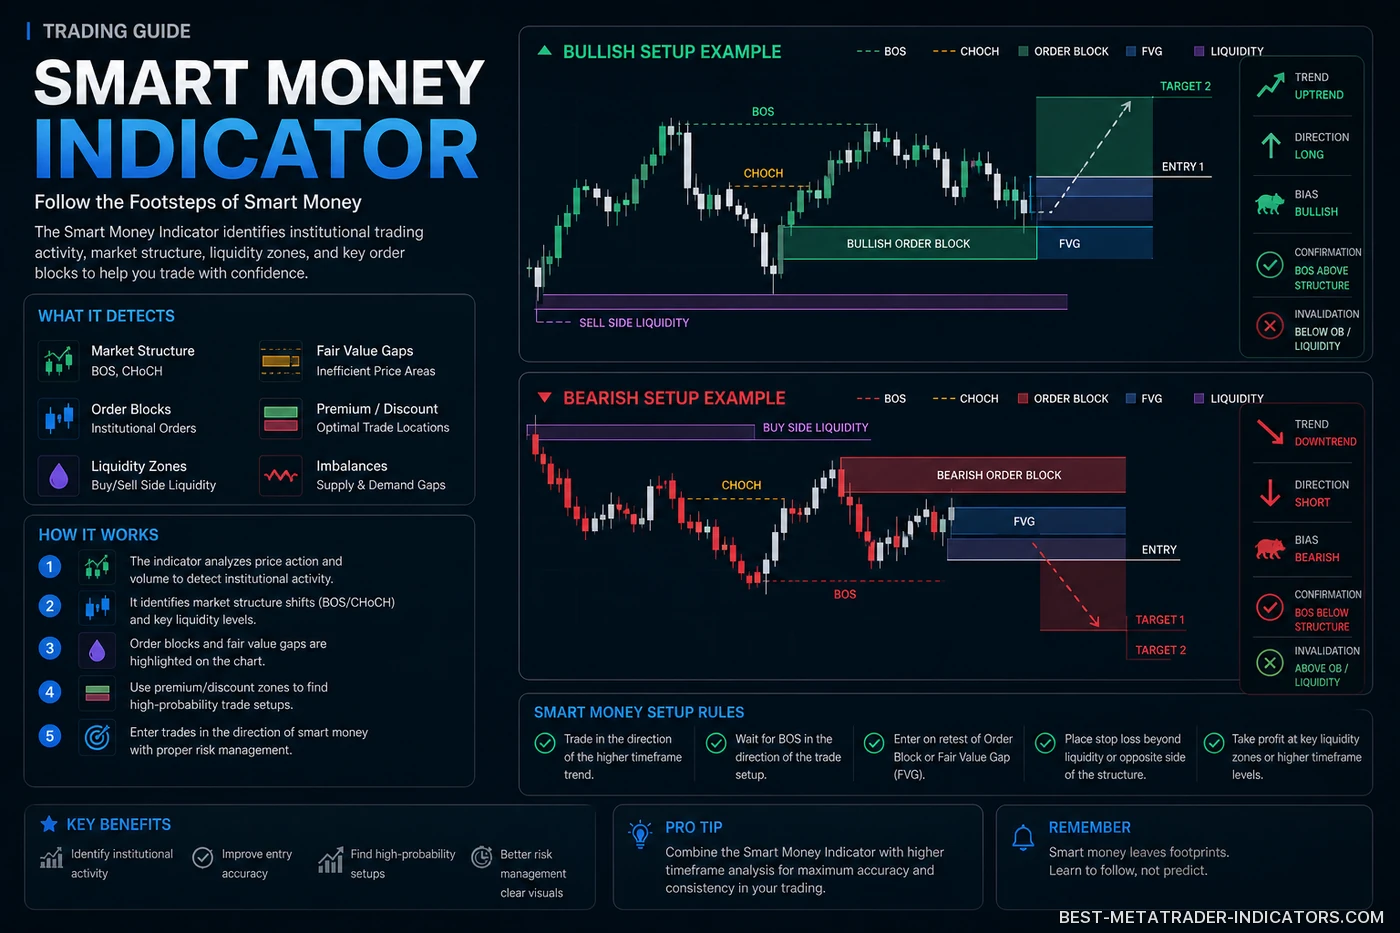
A smart money indicator is a trading tool or analytical framework designed to highlight areas where institutional-style activity may be visible on the chart. Unlike a simple moving average or oscillator, it usually focuses on market structure, liquidity zones, order blocks, fair value gaps, volume behavior, session timing, and displacement.
In Forex, the term “smart money” is often used for the side of the market with deeper liquidity, better execution, and a sharper understanding of where stop losses and pending orders are likely to sit. The goal for a retail trader is not to copy large players tick by tick. The goal is to stop trading blindly into obvious traps.
Professional note: A smart money indicator should never replace your trading plan. It should support your decision-making by showing context: where liquidity rests, where structure has shifted, and where price may rebalance before continuing.
📌 Core Concepts Behind Smart Money Trading
Liquidity
Liquidity is the fuel of the market. Stops above highs, stops below lows, equal highs, equal lows, and round numbers often become magnets for price.
Market Structure
Structure shows whether buyers or sellers are currently in control. Breaks of structure and changes of character can help identify a possible shift in order flow.
Imbalance
Fast displacement often leaves inefficient price action behind. Smart money traders watch whether price returns to rebalance these areas before continuing or reversing.
📈 Premium Forex Indicators That Give You the Trading Edge


🔎 What a Smart Money Indicator Usually Shows
Different platforms and developers use different formulas, but most smart money indicators try to visualize some combination of the following elements:
- Order blocks: price zones where a strong institutional-style move may have originated.
- Fair value gaps: areas of inefficient delivery where price moved quickly and may later return to rebalance.
- Liquidity sweeps: moves above or below obvious highs and lows that can trigger stops before a reversal or continuation.
- Break of structure: a confirmed break of a previous swing high or swing low.
- Change of character: an early sign that short-term control may be shifting from buyers to sellers or from sellers to buyers.
- Premium and discount zones: areas where price may be relatively expensive or cheap inside a defined dealing range.
- Session highs and lows: important reference levels from Asia, London, and New York trading sessions.
Risk warning: Smart money concepts can look perfect in hindsight. In live markets, liquidity sweeps can keep running, order blocks can fail, and fair value gaps can remain open far longer than expected. Always trade with defined risk.
📊 Smart Money Indicator vs Classic Forex Indicators
Classic indicators can be useful, but they often describe what has already happened. Smart money tools aim to map where price may seek liquidity next.
| Tool Type | Main Focus | Strength | Weakness | Best Use |
|---|---|---|---|---|
| Moving AveragesTrend-following | Average price direction | Clean trend filter | Lagging during reversals | Higher-timeframe bias |
| RSI / StochasticMomentum oscillator | Overbought and oversold readings | Good for momentum extremes | Can stay extreme in trends | Divergence and exhaustion |
| Smart Money IndicatorLiquidity and structure | Institutional-style footprints | Context around traps and liquidity | Requires interpretation | Confluence-based trade planning |
| Volume ToolsActivity analysis | Participation and relative pressure | Useful confirmation | Spot FX volume is broker-dependent | Confirmation around key zones |
⚙️ How to Use a Smart Money Indicator Step by Step
- Start with the higher timeframe. Mark the daily and 4-hour trend, important highs and lows, and obvious liquidity pools.
- Define the dealing range. Identify the most relevant swing high and swing low. This helps separate premium from discount pricing.
- Wait for liquidity to be taken. A clean sweep above a previous high or below a previous low can reveal where stops were collected.
- Look for displacement. Strong impulsive candles after a sweep may show that the market has rejected one side.
- Mark the origin zone. This may be an order block, imbalance, or fair value gap where price could return.
- Drop to a lower timeframe. Use the 15-minute, 5-minute, or 1-minute chart only after the higher-timeframe idea is clear.
- Execute only with invalidation. Every trade must have a level where the idea is proven wrong.
Execution principle: The best smart money trades usually combine three things: a liquidity event, a structural shift, and a logical entry zone with attractive risk-to-reward.
💡 Practical Smart Money Trading Strategies
Strategy 1: Liquidity Sweep Reversal
This setup begins when price moves above a previous high or below a previous low, triggers stops, and then quickly rejects the breakout.
- Mark equal highs or equal lows.
- Wait for a sweep and rejection candle.
- Confirm with a lower-timeframe shift.
- Enter on a pullback to imbalance or order block.
- Place the stop beyond the sweep extreme.
Strategy 2: Break of Structure Continuation
This setup looks for price to break structure in the direction of the higher-timeframe trend and then return to a high-probability retracement zone.
- Identify the higher-timeframe trend.
- Wait for a clear break of structure.
- Mark the last opposing candle before displacement.
- Enter only after price returns to a discount or premium zone.
- Target the next external liquidity pool.
Strategy 3: Fair Value Gap Rebalance
When price moves aggressively, it may leave an imbalance. Traders watch whether price returns to fill part of that gap before continuing.
- Look for a strong impulsive candle sequence.
- Mark the gap between candles.
- Confirm that the gap aligns with structure.
- Avoid entries if price returns slowly and weakly without confirmation.
Strategy 4: London or New York Session Raid
Forex liquidity often increases during London and New York. A session raid occurs when price takes an earlier session high or low and then reverses.
- Mark Asian session high and low.
- Wait for London or New York to take one side.
- Watch for displacement back into the range.
- Target the opposite side only when structure supports it.
🧾 Smart Money Trading Checklist
| Checklist Item | Question to Ask | Yes / No |
|---|---|---|
| Higher-timeframe bias | Do I know whether I prefer longs, shorts, or no trade? | ☐ |
| Liquidity location | Do I know which highs or lows price may target? | ☐ |
| Market structure | Has structure confirmed my idea? | ☐ |
| Entry zone | Is my entry based on a defined zone rather than emotion? | ☐ |
| Invalidation | Do I know exactly where the setup is wrong? | ☐ |
| Risk-to-reward | Is the potential reward worth the risk? | ☐ |
| Volatility filter | Have I checked whether current volatility fits my setup? | ☐ |
🎯 Best Currency Pairs for Smart Money Concepts
Smart money ideas can be applied across many Forex pairs, but they tend to work best where liquidity is deep, spreads are reasonable, and session behavior is clean enough to read.
EUR/USD
Highly liquid, tight spreads, and frequent technical reactions around London and New York liquidity zones.
GBP/USD
Often volatile and attractive for liquidity sweeps, but it demands disciplined stop placement and clean invalidation.
USD/JPY
Useful for structure-based trading when momentum is clean, but it requires patience because sharp continuation moves can punish early fades.
⏰ Session Timing Ideas
Timing matters. A smart money indicator may show the right zone, but the best reaction often happens when liquidity is active and spreads are stable.
- Asian session: often creates the range that later becomes a liquidity reference.
- London open: frequently delivers expansion, false breaks, or the first major raid of the day.
- New York open: can continue London direction or reverse it after liquidity is taken.
- London close: sometimes creates profit-taking, mean reversion, or reduced momentum.
Trader tip: Do not trade every zone the indicator prints. The quality of the zone depends on context, timing, liquidity, confirmation, and whether the stop loss can be placed logically.
🧩 Confluence: What Makes a Smart Money Signal Stronger?
A smart money signal becomes more meaningful when several independent technical factors point in the same direction. Look for stacked confluence rather than one isolated label on the chart.
Bullish Confluence
- Price is in a higher-timeframe discount zone.
- A sell-side liquidity sweep has occurred.
- Price breaks short-term bearish structure.
- A bullish order block or fair value gap remains below.
- Target liquidity is visible above.
Bearish Confluence
- Price is in a higher-timeframe premium zone.
- A buy-side liquidity sweep has occurred.
- Price breaks short-term bullish structure.
- A bearish order block or imbalance remains above.
- Target liquidity is visible below.
⚠️ Common Mistakes with Smart Money Indicators
| Mistake | Why It Hurts Performance | Better Approach |
|---|---|---|
| Trading every order block | Not every marked zone has real trading value. | Filter by structure, liquidity, and timeframe. |
| Ignoring higher timeframe | Lower-timeframe signals can be noise. | Build bias from daily, 4-hour, and 1-hour charts. |
| Entering before confirmation | Price may continue sweeping liquidity. | Wait for displacement or structure shift. |
| Using wide emotional stops | Risk becomes inconsistent and hard to manage. | Use technical invalidation before entry. |
| Overloading the chart | Too many zones create hesitation and conflicting signals. | Keep only the most relevant levels. |
🛠️ How to Build a Simple Smart Money Trading Plan
A solid trading plan keeps the indicator under control. Without rules, every candle starts to look like a signal. Use the following structure as a practical starting point:
- Market selection: Trade only two or three major pairs until your process is consistent.
- Timeframe hierarchy: Use daily and 4-hour charts for direction, 1-hour for setup, and 15-minute or lower for execution.
- Setup definition: Define exactly what must happen before you enter.
- Risk model: Risk a fixed percentage per trade and avoid increasing size after losses.
- Trade journal: Screenshot every setup before and after entry.
- Review cycle: Review your best and worst trades weekly.
Important: A smart money indicator can make your chart look professional, but profitability comes from execution, discipline, risk control, and patience. The indicator is only one part of the process.
📈 Example Trade Idea: Liquidity Sweep into Order Block
Imagine EUR/USD has been trending higher on the 4-hour chart. Price pulls back into a discount zone and sweeps a previous low during the London session. After the sweep, a strong bullish candle breaks short-term structure. The smart money indicator marks a bullish order block near the origin of the move.
A disciplined trader does not chase the bullish candle. Instead, the trader waits for price to return into the order block, checks whether the risk-to-reward remains attractive, places invalidation below the swept low, and targets the next buy-side liquidity area.
Key lesson: The entry is not the sweep itself. The entry is the planned reaction after the sweep, once structure and risk make sense.
🧠 Advanced Tips from Professional Trading Experience
- Do not fight the daily narrative. A perfect 5-minute setup against a strong daily trend often fails.
- Respect abnormal volatility. Sudden spreads, thin liquidity, and violent candles can distort even clean technical setups.
- Mark fewer levels. The more zones you draw, the less useful your chart becomes.
- Watch candle speed. Strong displacement matters more than slow drifting price action.
- Trade after the trap, not before it. Let the market reveal where liquidity has been taken.
- Think in scenarios. Plan what you will do if price sweeps the high, sweeps the low, or does nothing.
- Journal emotional mistakes. The smart money model fails if the trader is still controlled by fear and greed.
🔐 Risk Management Rules
Rules to Follow
- Risk only a small fixed percentage per trade.
- Use a stop loss based on invalidation.
- Predefine partial profit levels.
- Stop trading after reaching a daily loss limit.
- Avoid revenge trading after a sweep goes wrong.
Rules to Avoid
- Do not move the stop because you “feel” price will return.
- Do not add to losing trades without a tested plan.
- Do not trade every session if your edge is session-specific.
- Do not risk more because a setup looks obvious.
- Do not confuse a beautiful chart with a high-probability trade.
❓ Smart Money Indicator FAQ
Is a smart money indicator suitable for beginners?
Yes, but beginners should first understand basic market structure, risk management, and support and resistance. Without those foundations, smart money tools can become confusing.
Does smart money trading work in Forex?
It can be useful because Forex is heavily liquidity-driven. However, no concept works all the time. The trader must test rules, manage risk, and adapt to changing price behavior.
Which timeframe is best?
Use higher timeframes for direction and lower timeframes for execution. Many traders combine 4-hour, 1-hour, and 15-minute charts.
Is an order block the same as support or resistance?
Not exactly. Support and resistance are broad reaction areas. An order block is usually tied to the origin of displacement and a structural move.
Can I use smart money indicators with RSI or moving averages?
Yes. A moving average can help define trend direction, while RSI may help identify exhaustion. Smart money concepts can then provide entry context.
What is the biggest danger?
The biggest danger is hindsight bias. Many smart money concepts look simple after the move, but live execution requires patience and strict invalidation.
✅ Final Checklist Before Using a Smart Money Indicator Live
- Have you backtested the indicator across at least several months of data?
- Do you know which sessions and pairs fit your strategy best?
- Have you written exact entry, stop, and target rules?
- Can you explain why a zone matters without relying only on the indicator label?
- Have you tested your risk model during losing streaks?
- Do you have a journal process for continuous improvement?
🏁 Conclusion: Smart Money Indicators Are Tools, Not Guarantees
A smart money indicator can be a powerful addition to a Forex trader’s toolbox when used correctly. It can help you identify liquidity, understand structure, avoid obvious retail traps, and plan trades around institutional-style price behavior.
But the edge is not in the indicator alone. The edge comes from combining smart money context with patience, execution discipline, clear invalidation, risk control, and constant review. Use the indicator to improve your reading of the market, not to outsource your thinking.
Trade less, plan better, and let liquidity tell the story.
Disclaimer: Trading Forex and CFDs involves risk. Technical analysis, indicators, and trading strategies do not guarantee profitable results. Always use a defined stop loss, manage position size carefully, and trade only with capital you can afford to lose.