Submit your review | |
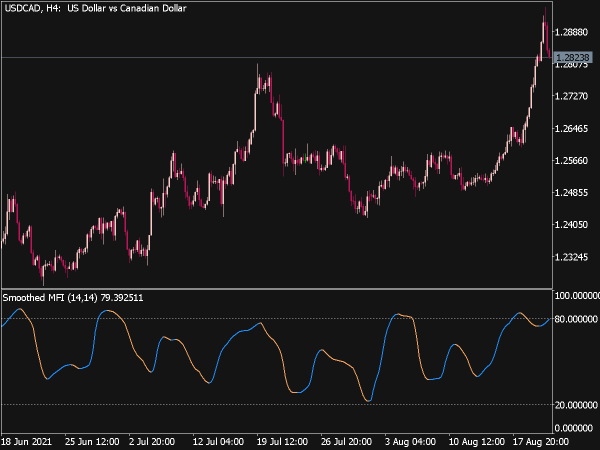
Money Flow Index (MFI) is a momentum indicator which is similar to the Relative Strength Index (RSI), but instead of measuring an asset's price action relative to itself, MFI also measures the volume. In simple terms, we can say that MFI is used to measure the amount of money flowing into and out of a market instrument.
The main idea behind MFI is to spot trend reversals by comparing price and volume. MFI is a range bound indicator which oscillates between 0 and 100. Just like RSI does, MFI also has overbought and oversold regions. Above 80 is considered overbought and below 20 is considered oversold.
As money flow index is similar to the RSI, so we can look for commonalities between the two indicators. When the MFI is above 80, we can say a potential market top is in play, thus we can look for shorting opportunities. While a reading below 20 indicates a market bottom and hence we can look for buying opportunities. Another technique is if the price action and the MFI are both in unison then we can trade in the direction of that trend.
📌 Great Indicators and Trading Systems for MT4 or MT5
- Top-Rated MetaTrader Indicators


- Smooth ATR Indicator

- Log Sigmoidal Normalized Jurik Smooth

- Dual Ulcer Index Indicator

- Congestion Index Indicator

- Color MFI X20 Indicator

- J-Smooth Moving Average

- MFI Histogram Round Indicator

- Market Meanness Index Indicator

- Triple Jurik Smooth Indicator

- Smooth ATR Indicateur

- ATR Adaptive Smooth Laguerre RSI

- Smart Money Pressure Oscillator

- MFI Price Indicator (MQ5)
")
- True Strength Index Oscillator

- FX5 Self Adjusting MFI Indicator

- Currency Index Indicator

- Trend Intensity Index Indicator

- Zig Zag MFI Indicator

- Choppy Market Index Smoothed

- Force Index JMA Indicator

- Non-Repainting Non-Lagging Indicators