Submit your review | |
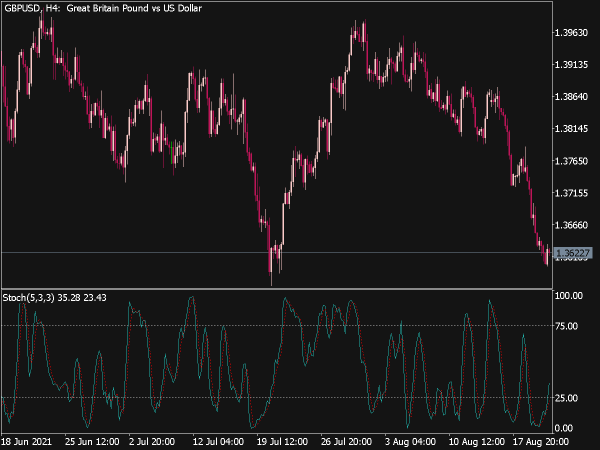
Stochastic oscillator is a momentum indicator. This indicator was developed by George C. Lane in the late 1950s. The main idea behind this oscillator was as price rises in an uptrend, closing price tends to close near highs and in a down trend closing prices tend to close near its lows.
This indicator consists of two lines, first line called as %K which compares the latest closing price to the recent trading range and second line called %D which is a signal line calculated by taking 3-period simple moving average of %K. The formula is as follow:
%K = (previous close – lowest low) / (highest high – lowest low) * 100
%D = 3-period SMA of %K
Lowest low and highest high are taken from previous n-bars, "n" is the parameter given to %K, Lane recommended 14 for the value of "n" however we can change this value as per our preference to suit our trading plan.
These two lines range from 0 to 100. There are two regions on the stochastic graph called as overbought region and oversold region. The pair is considered overbought when the lines are above the 80 value, and considered oversold when the lines are below 20.
One way to trade stochastic would be to consider a long trade when the lines are in oversold region, we can enter when the %K line crosses over %D line and we can then exit the trade when the lines enter the overbought region. And when the lines are in overbought zone we can consider short trade, we can enter when %K line crosses %D line and we can exit the trade when the lines enter the oversold region.
Stochastic oscillator can be used to spot reversal in the trend by spotting divergence. If we can spot bullish divergence in a downtrend we can say the price is making a reversal similarly if we can find a bearish divergence in an uptrend we can say the price is making reversal.
📌 Great Indicators and Trading Systems for MT4 or MT5
- Top-Rated MetaTrader Indicators


- Blau Stochastic Index Oscillator

- Stochastic MACD Indicator

- VWap Custom Position Indicator

- BB Stops Stochastic Indicador

- MTF Stochastic RSI Indicator

- Step Stochastic V2.1 Indicator

- CCI Custom Candles Indicator (MQL5)
")
- Stochastic of Choosable Price…

- Pivot Fibs Custom Arr Indicator

- Time Candle Custom Indicator

- Custom Bulls Power Inputs

- METRO Stochastic Sign Indicator

- On Chart Stochastic Indicator

- Pivot Fibs Custom Indicator

- Dinapoli Stochastic

- Stochastic Expansion Indicator

- Custom Moving Average Input Color

- 3 (Three Timeframes)…
 Stochastic Average")
- Stochastic of Hull Average

- 3 in 1 MTF Stochastic with MA…

- Non-Repainting Non-Lagging Indicators