A supply and demand indicator is built to identify price zones where strong buying or selling pressure previously entered the market. For Forex traders, these zones can become practical reference points for entries, exits, stop-loss placement, take-profit planning, and overall trade management.
Unlike a basic support and resistance indicator, a supply and demand tool focuses on areas where price moved away with force, often pointing to a clear imbalance between buyers and sellers. Used with judgment, it helps traders avoid random entries and build a more structured trading process around price action instead of impulse.
📌 What Is a Supply and Demand Indicator?
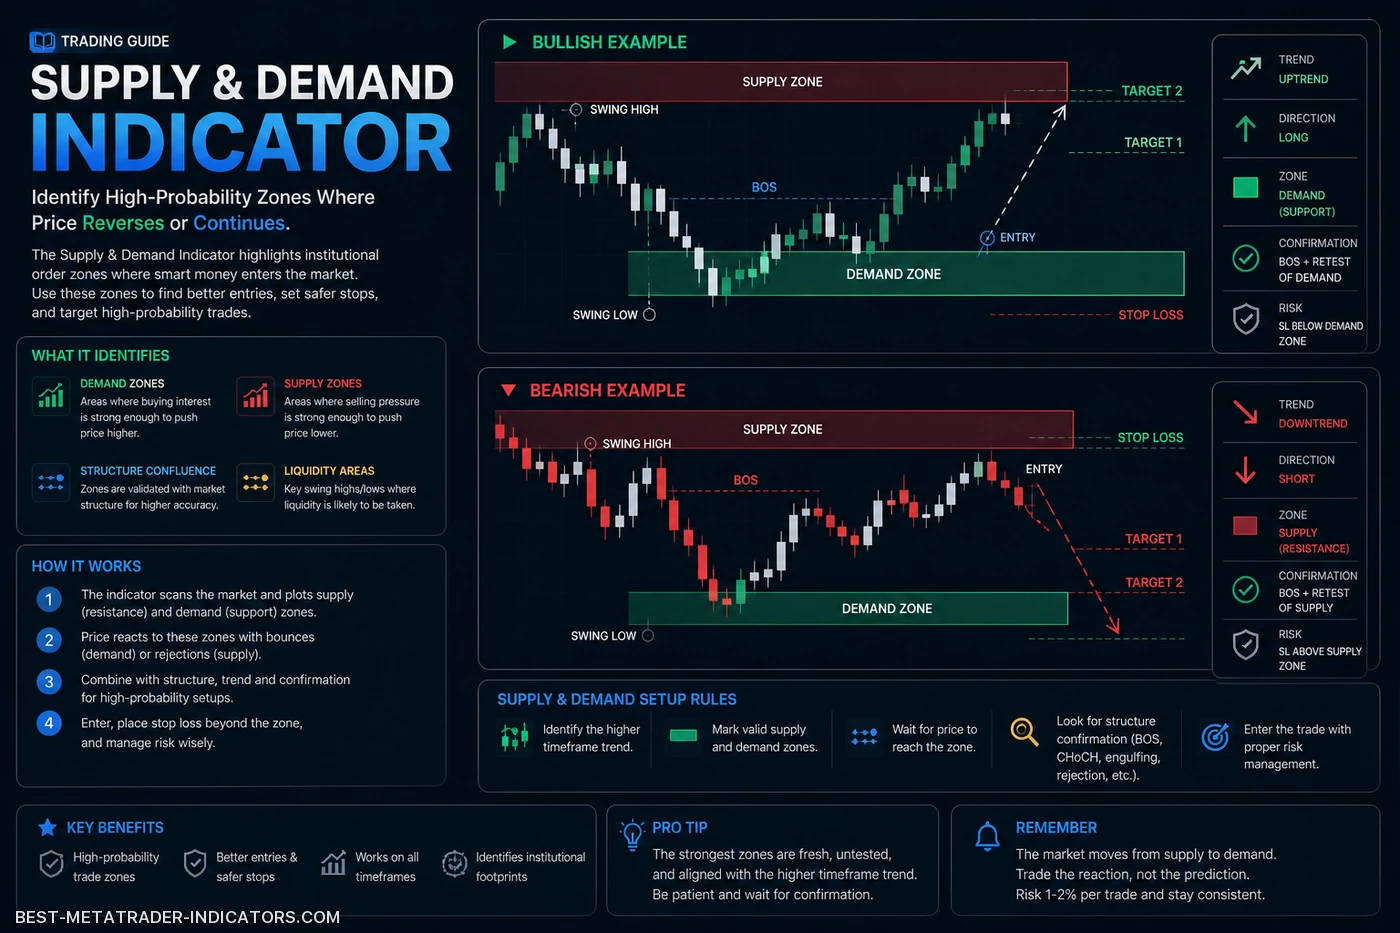
A supply and demand indicator marks potential demand zones and supply zones directly on the chart, usually as shaded rectangles that can be read quickly inside MetaTrader or similar trading platforms.
Demand Zone
A demand zone is an area where buying pressure was strong enough to push price higher. Traders often watch these zones for possible long setups, especially when price returns with slower momentum or shows rejection.
Supply Zone
A supply zone is an area where selling pressure was strong enough to push price lower. Traders often watch these zones for possible short setups, particularly when the market approaches the area after an extended move.
The core idea is simple: if large orders or aggressive participation appeared around a specific price area before, price may react when it revisits that area. Still, no zone is guaranteed. A supply and demand indicator should support the decision-making process, not act as an automatic buy or sell signal.
🧩 The Missing Piece Behind Cleaner Forex Entries and Exits


⚙️ How Supply and Demand Indicators Work
Most supply and demand indicators scan historical price action and detect areas where price consolidated briefly before moving away with momentum. These areas are then plotted as rectangles or shaded zones, giving the trader a visual map of possible reaction areas.
| Element | What It Means | Trader’s Interpretation |
|---|---|---|
| Base | A short consolidation before a strong move | Possible area where orders built up before the breakout |
| Impulse Move | Strong movement away from the base | Shows imbalance between buyers and sellers |
| Fresh Zone | Price has not returned to the zone yet | Often considered higher quality |
| Mitigated Zone | Price has already revisited the zone | May be weaker after a previous reaction |
📊 Supply and Demand vs Support and Resistance
Many traders confuse supply and demand with classic support and resistance. They are related, but they are not identical, and mixing them without a clear plan can lead to messy charts and weak entries.
Comparison of two popular price action concepts used by Forex traders.
| Feature | Supply and Demand | Support and Resistance |
|---|---|---|
| Main FocusMarket imbalance | Zones where strong buying or selling pressure appeared | Levels where price previously reacted |
| Chart AreaZone vs line | Usually marked as wider zones | Often drawn as horizontal lines |
| Entry LogicReaction based | Wait for price to return to a high-quality zone | Trade bounces or breakouts around key levels |
| Best UseContext matters | Trend continuation, reversals, liquidity reactions | General structure, range trading, breakout planning |
🧠 Why Forex Traders Use Supply and Demand Indicators
Forex markets are shaped by liquidity, order flow, momentum shifts, volatility cycles, and trader positioning. A supply and demand indicator does not reveal actual institutional orders, but it can help traders identify where aggressive market participation may have appeared on the chart.
Cleaner Chart Structure
The indicator highlights important zones so traders can focus on meaningful price areas instead of chasing every candle that moves quickly.
Better Risk Planning
Zones can help define logical stop-loss placement and realistic take-profit targets before entering a trade.
Improved Patience
Instead of entering randomly, traders can wait for price to reach a pre-defined area of interest and then decide whether the reaction is worth trading.
🚀 Popular Supply and Demand Trading Strategies
1. Fresh Zone Reversal Strategy
This strategy focuses on fresh zones that price has not revisited yet. The idea is to wait for price to return to a strong supply or demand area and then look for confirmation before entering, rather than placing a blind order at the edge of the zone.
- Identify a strong impulse move away from a base.
- Mark the supply or demand zone.
- Wait for price to return to the zone.
- Look for confirmation such as rejection candles, lower timeframe structure shift, or momentum slowdown.
- Place the stop beyond the zone and target the next opposing zone.
Trader’s note: Fresh zones often attract attention because they may still hold untested interest. Even so, I would still want market structure, clean execution conditions, and acceptable risk-to-reward before taking the trade.
2. Trend Continuation Pullback Strategy
In a strong trend, supply and demand zones can help traders find pullback entries. For example, in an uptrend, traders may look for demand zones that form after a bullish breakout and then wait for price to return without breaking the broader structure.
- Trade demand zones in an uptrend.
- Trade supply zones in a downtrend.
- Avoid counter-trend trades unless there is strong reversal evidence.
- Use higher timeframe direction as a filter.
3. Breakout and Retest Strategy
When price breaks through a major zone, that area may change its role. A broken supply zone can become a potential demand zone, while a broken demand zone can become potential supply, especially when the retest is controlled and the market holds structure.
Practical idea: Wait for a clean breakout, then look for a controlled retest. Avoid entering immediately after a large candle because price often pulls back, fills part of the move, or tests the broken zone before deciding on direction.
4. Multi-Timeframe Zone Alignment
This strategy combines higher timeframe zones with lower timeframe confirmation. For example, a trader may identify a demand zone on the daily chart, then use the 1-hour or 15-minute chart to refine the entry and place the stop with more precision.
| Timeframe | Purpose | Example |
|---|---|---|
| Daily / 4H | Identify major supply and demand zones | Find the main area of interest |
| 1H / 30M | Refine the zone and observe reaction | Watch for slowdown or structure change |
| 15M / 5M | Plan precise entry and stop placement | Use confirmation before execution |
📡 Advanced Signal Intelligence for MT4 & MT5 Traders
✅ Supply and Demand Trading Checklist
Before Entering a Trade
- Is the zone fresh or already tested?
- Did price leave the zone with strong momentum?
- Is the zone aligned with the higher timeframe trend?
- Is there enough space to the next opposing zone?
- Does the trade offer at least a reasonable risk-to-reward ratio?
- Is there confirmation from price action or market structure?
- Are spreads, volatility, and session conditions suitable for the setup?
💡 Practical Tips for Using a Supply and Demand Indicator
Do Not Trade Every Zone
Many indicators draw too many zones. Focus only on clean, obvious zones with strong moves away from the base and avoid forcing trades in the middle of choppy structure.
Use Market Structure
A demand zone is stronger when the market is making higher highs and higher lows. A supply zone is stronger when the market is making lower highs and lower lows.
Watch the First Retest
The first return to a zone is often more interesting than later retests because available liquidity may be consumed over time.
Combine with Volume Carefully
Forex volume is usually tick volume, not centralized exchange volume. It can still be useful inside MetaTrader, but it should be treated as activity data rather than perfect institutional volume.
⚠️ Common Mistakes Traders Make
Warning: A supply and demand indicator can make zones look more precise than they really are. Forex trading always involves uncertainty, slippage, spread changes, false breakouts, and failed reactions.
- Entering blindly: A zone alone is not a complete trading plan.
- Ignoring the trend: Counter-trend zones fail more often in strong momentum markets.
- Using zones that are too wide: Wide zones can create poor risk-to-reward setups.
- Moving stop-losses: If the trade idea is invalidated, accept the loss.
- Trading in unstable conditions: Sudden volatility and wider spreads can damage otherwise clean technical setups.
- Overloading indicators: Too many tools can create analysis paralysis.
🧩 Best Indicator Settings and Filters
The best supply and demand indicator settings depend on your trading style. Scalpers usually need more sensitive settings, while swing traders often prefer fewer but stronger zones that do not clutter the chart.
| Trader Type | Preferred Zones | Suggested Filter |
|---|---|---|
| Scalper | Short-term zones on 1M to 15M charts | Use spread filter and session timing |
| Day Trader | Intraday zones on 15M to 1H charts | Confirm with market structure and volatility |
| Swing Trader | Major zones on 4H to weekly charts | Check higher timeframe trend and distance to opposing zones |
🛠️ Strategy Idea: The 3-Step Zone Filter
One simple way to improve selectivity is to use a three-step filter before taking any setup. It keeps the trader from reacting emotionally just because an indicator has drawn a fresh rectangle on the chart.
Step 1: Location
Is the zone at a meaningful high, low, breakout area, or higher timeframe level?
Step 2: Reaction
Did price leave the zone with momentum, displacement, or a clear structure break?
Step 3: Confirmation
Does the lower timeframe show rejection, absorption, or a valid entry trigger?
📈 Example Trade Plan Using Supply and Demand
Example: EUR/USD Demand Zone Setup
- Daily chart shows an uptrend.
- Price breaks above a previous high and creates a new demand zone.
- Trader waits for price to return to that zone.
- On the 15-minute chart, price forms a bullish rejection candle.
- Entry is planned after confirmation, stop below the demand zone, target near the next supply area.
This type of plan keeps the trader focused on process rather than emotion. The goal is not to predict every market movement, but to wait for conditions where risk, reward, and execution timing make sense.
🧾 Pros and Cons of Supply and Demand Indicators
Every trading tool has strengths and weaknesses. A supply and demand indicator is no exception.
| Pros | Cons |
|---|---|
| Helps identify important price zones quickly | Can draw too many zones on messy charts |
| Useful for planning entries, stops, and targets | May create false confidence if used blindly |
| Works across multiple timeframes and currency pairs | Requires trader judgment and confirmation |
| Can improve patience and discipline | Does not predict sudden volatility or failed zone reactions |
🧠 Advanced Notes for Experienced Traders
Advanced perspective: The quality of a supply or demand zone often depends on context. A small zone that breaks structure near a higher timeframe level can be more valuable than a large zone sitting in the middle of a choppy range.
- Prioritize zones that cause a break of structure.
- Be careful with zones formed during low-liquidity sessions.
- Watch how price approaches the zone: fast approach, slow grind, or compression.
- Use session context: London and New York often provide stronger reactions than quiet Asian-range conditions.
- Mark opposing liquidity pools before setting targets.
🚀 Advanced Forex Tools for Traders Who Want an Edge
❓ Supply and Demand Indicator FAQ
What is the best supply and demand indicator?
The best indicator is the one that marks clean, logical zones without overcrowding the chart. Traders should test different MetaTrader-compatible tools and verify the zones manually.
Can beginners use supply and demand indicators?
Yes, but beginners should first understand price action, trend structure, and risk management. The indicator should support learning and trade planning, not replace chart-reading skill.
Is supply and demand better than support and resistance?
Not necessarily. Supply and demand focuses more on imbalance, while support and resistance focuses on historical reaction levels. Many traders use both when the chart structure is clear.
Do supply and demand zones always work?
No. Zones fail frequently, especially during strong trends, liquidity sweeps, or sudden volatility. Risk management is essential on every setup.
Which timeframe is best?
Higher timeframes usually provide stronger zones, while lower timeframes offer more precise entries. Many traders combine both to avoid entering too early or placing stops too wide.
Should I enter immediately at the zone?
Experienced traders often wait for confirmation. Blind entries can work occasionally, but they require strict risk control, defined invalidation, and extensive testing.
🏁 Final Thoughts
A supply and demand indicator can be a powerful addition to a Forex trader’s toolkit when it is used with discipline, context, and a clear trading plan. It helps identify areas where price may react, but it does not remove uncertainty from the market.
The strongest approach is to combine supply and demand zones with market structure, higher timeframe analysis, confirmation signals, and strict risk management. In professional trading, the goal is not to find a perfect indicator. The goal is to build a repeatable process that protects capital and allows profitable opportunities to develop over time.
Disclaimer: Trading Forex and CFDs involves risk and can lead to losses. Technical analysis, indicators, and trading strategies do not guarantee future results. Always use a defined stop loss, plan your take profit before entry, and risk only capital you can afford to lose.
📌 More Free Indicators and Trading Systems for MT4 or MT5
- Top-Rated MetaTrader Indicators


- The Smart Money Indicator…

- Swing Trading Indicator Setups…

- Mastering RSI in Forex…

- Supporting Adx Indicator

- Best Beginner Forex Indicators…

- Inside the Stochastic…

- ICT Indicator Strategies Every…

- Support Resistance Lines Indicator

- Support Resistance Levels Indicator

- Resistance & Support Indicator

- Supply and Demand Indicator

- Pivot Resistance Support Indicator

- Support Resistance Zones Indicator

- Best Hedge Fund Indicator…

- Support and Resistance Indicator

- Support and Resistance MTF Indicator

- Liquidity Zones Indicators…

- Support and Resistance Zone Indicator

- Support & Resistance Trading Indicator

- Footprint Indicator: The…

- Premium Indicators for MT4 and MT5