Swing trading in Forex is the art of capturing meaningful price moves that may last from a few days to several weeks. Unlike scalping, swing trading does not demand constant screen time. Unlike long-term position trading, it still gives active traders frequent opportunities across major, minor and selected exotic currency pairs.
The right swing trading indicator can make your analysis cleaner, your entries more selective and your risk management more disciplined. After years of watching traders succeed and fail, one truth remains unchanged: indicators are tools, not magic signals. The best results come when indicators confirm price structure, market rhythm and a clear trading plan.
📊 What Is a Swing Trading Indicator?
A swing trading indicator is a technical analysis tool used to identify potential medium-term buying or selling opportunities. In Forex, these indicators help traders evaluate whether a currency pair is trending, ranging, overextended, losing momentum or approaching a key reversal zone.
Good swing trading indicators usually answer one or more of these questions:
- Is the market trending or ranging?
- Where is momentum increasing or fading?
- Is price near support, resistance or a moving average zone?
- Is volatility high enough to justify a trade?
- Where could a logical stop-loss and take-profit be placed?
Trader’s note: The purpose of an indicator is not to predict the future with certainty. Its purpose is to organize price information so you can make better decisions under uncertainty.
🧩 The Market Leaves Clues. Most Traders Miss Them.


🧭 Why Swing Traders Use Indicators in Forex
Forex markets move through clean trends, sharp pullbacks, tight ranges and sudden volatility expansions. Because currencies often travel in waves, swing traders use indicators to filter chart noise and focus on structured technical opportunities.
Trend Direction
Indicators such as moving averages help traders identify whether the broader market bias is bullish, bearish or neutral.
Momentum Confirmation
Tools such as RSI, MACD and Stochastic can show whether a move has strength or is beginning to lose energy.
Risk Placement
Volatility indicators such as ATR can help define more realistic stop-loss and take-profit levels.
⚙️ The Best Swing Trading Indicators for Forex
There is no single best swing trading indicator for every trader or every market condition. However, several indicators have proven useful because they measure different parts of the chart: trend, momentum, volatility and price extremes.
Popular Forex Swing Trading Indicators Compared
Use this comparison to understand what each indicator does best — and where it can fail.
| Indicator | Main Purpose | Best Market Condition | Common Mistake | Trader Rating |
|---|---|---|---|---|
| Moving AveragesEMA / SMA | Trend direction and dynamic support/resistance | Trending markets | Using them in choppy ranges without confirmation | ★★★★★ |
| RSIRelative Strength Index | Momentum, overbought/oversold zones and divergence | Reversals and pullbacks | Selling every overbought reading in a strong uptrend | ★★★★☆ |
| MACDTrend + momentum | Momentum shifts and trend confirmation | Developing trends | Entering too late after a large price move | ★★★★☆ |
| ATRAverage True Range | Volatility and stop-loss distance | All market conditions | Ignoring ATR and placing stops too tight | ★★★★★ |
| Bollinger BandsVolatility bands | Volatility expansion, compression and mean reversion | Ranges and breakout preparation | Assuming every band touch is a reversal | ★★★★☆ |
📈 Moving Averages: The Classic Swing Trading Indicator
Moving averages remain one of the most reliable tools for swing traders because they simplify trend direction. A 20-period EMA may help identify short-term pullbacks, a 50-period EMA often reflects intermediate trend structure, and a 200-period moving average can define the broader market bias.
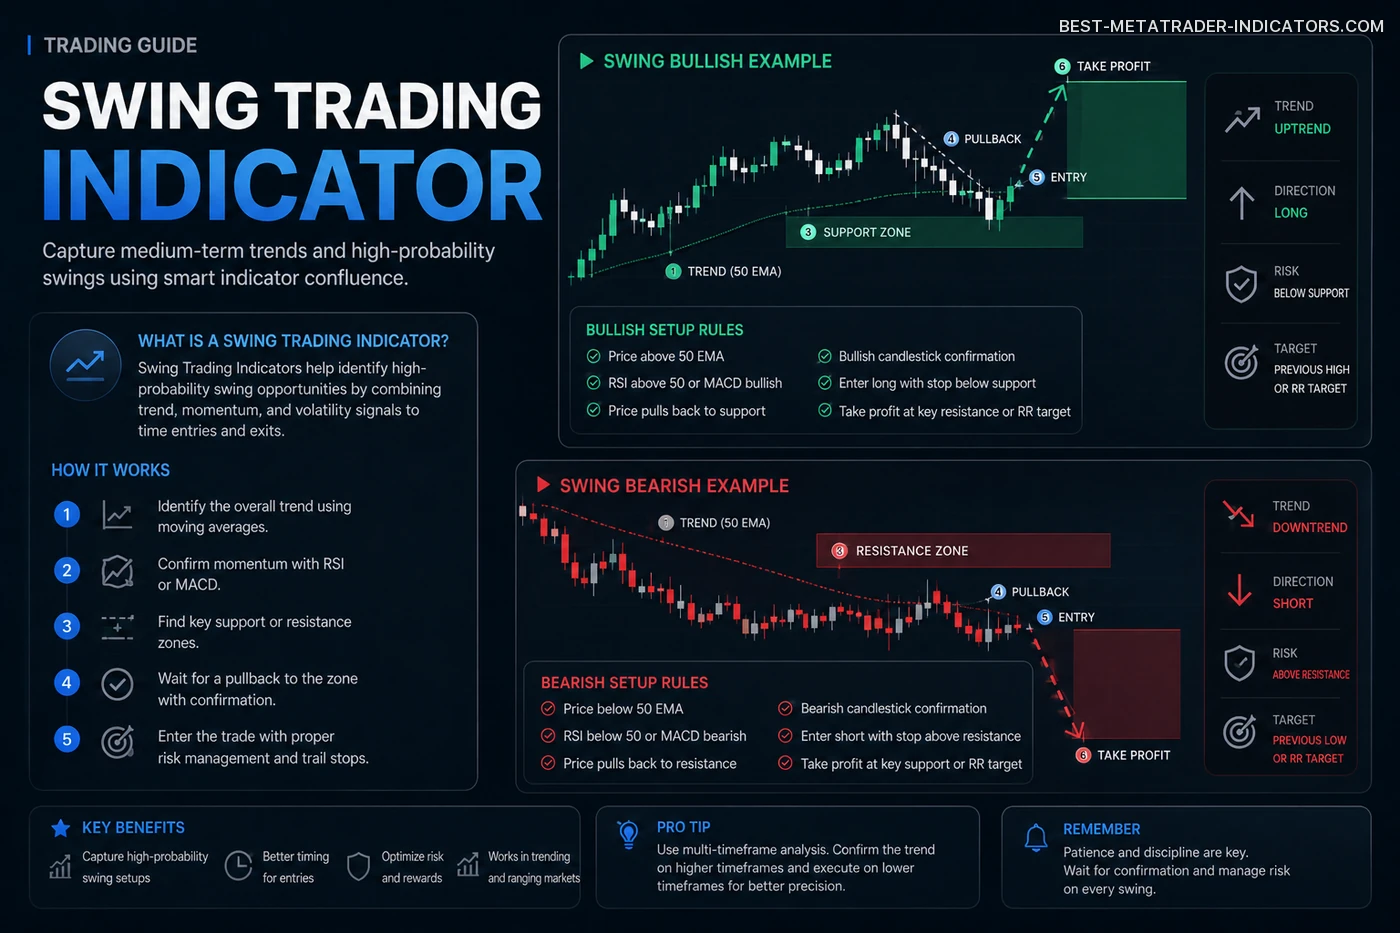
A simple Forex swing trading approach is to trade in the direction of the 50 EMA and use pullbacks toward the 20 EMA or 50 EMA as potential entry zones. This does not mean buying blindly at the moving average. Instead, the trader waits for price action confirmation such as rejection candles, higher lows or lower highs.
Practical idea: In an uptrend, look for price above the 50 EMA, a controlled pullback, bullish rejection near support, and improving momentum. In a downtrend, reverse the logic.
⚡ RSI for Swing Trading: Momentum and Divergence
The Relative Strength Index is widely used to measure momentum. Many beginners treat RSI above 70 as an automatic sell signal and RSI below 30 as an automatic buy signal. In real trading, this is too simplistic.
In strong trends, RSI can remain overbought or oversold for longer than expected. A better use is to combine RSI with structure. For example, if EUR/USD is in an uptrend and RSI pulls back toward the 40–50 zone while price holds a higher low, the market may be preparing for another bullish swing.
Bullish RSI Clue
Price forms a higher low while RSI holds above 40 or creates bullish divergence near support.
Bearish RSI Clue
Price forms a lower high while RSI fails below 60 or creates bearish divergence near resistance.
🔁 MACD: Spotting Momentum Shifts
MACD is useful for identifying changes in momentum. Swing traders often watch MACD line crosses, histogram expansion and divergence between price and momentum. A MACD signal is more meaningful when it appears near a key price zone rather than in the middle of nowhere.
For example, if GBP/USD pulls back to a previous support level and MACD histogram begins to rise from negative territory, the setup may suggest that bearish pressure is fading. However, confirmation from candles and risk-reward structure is still required.
🌪️ ATR: The Indicator Many Traders Ignore
Average True Range does not tell you whether to buy or sell. Instead, it tells you how much the market is moving. This makes ATR one of the most important risk management tools for swing traders.
If a pair has an ATR of 90 pips on the daily chart, a 20-pip stop-loss may be unrealistic. The normal daily movement could stop you out before the setup has time to develop. Many professional traders use ATR-based stops to avoid being shaken out by ordinary volatility.
Risk warning: Forex trading involves substantial risk. A wider ATR-based stop does not mean you should risk more money. Position size must be reduced when stop distance increases.
📈 Accurate Non-Repainting Indicators for MT4 and MT5
🧩 A Simple Swing Trading Indicator Strategy
The strongest trading systems are often simple. A good swing trading strategy should combine market structure, trend direction, momentum and risk control. Below is a practical framework that can be tested on major Forex pairs.
| Step | Action | Indicator or Tool |
|---|---|---|
| 1 | Identify the dominant trend on the daily chart | 50 EMA and 200 EMA |
| 2 | Wait for a pullback into a logical value area | 20 EMA, 50 EMA, support/resistance |
| 3 | Check whether momentum supports the setup | RSI or MACD |
| 4 | Define stop-loss using market structure and volatility | ATR and recent swing high/low |
| 5 | Only take the trade if reward is worth the risk | Minimum 1:2 risk-reward preference |
🛠️ Example Setup: Trend Pullback Strategy
Here is a practical swing trading indicator setup that many traders can adapt and backtest:
- Open the daily chart of a major pair such as EUR/USD, GBP/USD, USD/JPY or AUD/USD.
- Add the 20 EMA, 50 EMA, 200 EMA, RSI and ATR.
- Trade long only when price is above the 200 EMA and the 50 EMA is sloping upward.
- Wait for price to pull back toward the 20 EMA or 50 EMA.
- Look for bullish price action such as a pin bar, engulfing candle or higher low.
- Confirm that RSI remains constructive, ideally holding above the 40–50 area.
- Place the stop-loss below the recent swing low or at an ATR-adjusted level.
- Target the previous swing high, a resistance zone or a minimum 1:2 risk-reward level.
Important: This is not a guaranteed system. It is a structured decision model. Every trader should backtest, forward test and adapt the rules to their personality, account size and trading schedule.
🧠 Trading Ideas for Different Market Conditions
One reason traders struggle with indicators is that they use the same tool in every environment. A moving average strategy works well in trends but may fail during sideways consolidation. An oscillator can work beautifully in ranges but may produce repeated false signals in strong trends.
Trending Market
Use moving averages, MACD and pullback entries. Avoid fighting the trend just because RSI looks overbought or oversold.
Ranging Market
Use RSI, Bollinger Bands and support/resistance. Focus on buying near range lows and selling near range highs.
Breakout Market
Use ATR, Bollinger Band compression and price structure. Wait for a breakout and retest instead of chasing the first candle.
✅ Swing Trading Indicator Checklist
Before entering a swing trade, run through this checklist. If too many answers are unclear, the best trade may be no trade.
- Trend: Is the pair trending, ranging or breaking out?
- Structure: Is price near support, resistance, a swing high, a swing low or a moving average zone?
- Momentum: Does RSI, MACD or another momentum indicator support the idea?
- Volatility: Is ATR large enough to offer opportunity, but not so large that risk becomes unstable?
- Entry: Is there a clear trigger, or are you entering because of fear of missing out?
- Stop-loss: Is the stop placed beyond logical market noise?
- Position size: Does the trade risk fit your account rules?
- Reward: Is the potential reward at least twice the planned risk?
- Volatility window: Is the market currently behaving normally, or is price movement unusually stretched?
- Journal: Can you explain the trade in one clear sentence?
🚫 Common Mistakes When Using Swing Trading Indicators
Indicators can help, but they can also create confusion when traders overload their charts or use them without context.
Too Many Indicators
If five indicators all measure momentum, you do not have five confirmations. You have one idea repeated five times.
No Market Structure
A signal is weaker if it does not appear near a meaningful price level such as support, resistance or a prior swing point.
Ignoring Volatility
Fast candles, thin liquidity and sudden range expansion can invalidate technical setups quickly if the stop-loss is poorly placed.
Changing Rules Too Often
Jumping from one indicator to another prevents you from collecting useful performance data.
📝 Professional Tips for Better Swing Trading
- Trade fewer pairs: Focus on a watchlist of liquid pairs instead of scanning every symbol.
- Use higher timeframes: Daily and 4-hour charts often filter noise better than lower intraday charts.
- Wait for confluence: A moving average, support level and momentum shift together are stronger than one isolated indicator signal.
- Respect correlation: Multiple trades with the same directional driver may increase total exposure without you realizing it.
- Journal every trade: Track setup type, entry reason, stop placement, exit reason and emotional state.
- Think in probabilities: A good setup can lose. A bad setup can win. Process matters more than one result.
⚖️ Indicator-Based Trading vs Price Action Trading
Some traders prefer clean charts with only support, resistance and candlestick patterns. Others prefer indicators for confirmation. In practice, the best approach is often a combination of both.
| Approach | Strength | Weakness | Best Use |
|---|---|---|---|
| Indicator-Based Trading | Clear rules and repeatable signals | Can lag behind price | Trend filtering, momentum confirmation, volatility planning |
| Price Action Trading | Direct reading of market behavior | Can be subjective | Entries, rejections, breakouts, support and resistance |
| Combined Approach | Balances structure and confirmation | Requires discipline and testing | Most swing trading plans |
📌 Risk Management Rules for Swing Traders
A swing trading indicator may help you find opportunities, but risk management determines whether you survive long enough to benefit from them. Many traders focus on entries, while professionals focus on risk first.
Core rule: Decide how much you are willing to lose before you think about how much you might make. A common professional approach is to risk only a small fixed percentage of account equity per trade.
- Never move a stop-loss farther away because you “feel” the trade will turn around.
- Avoid stacking multiple correlated trades with the same directional exposure.
- Reduce position size during abnormal volatility or unstable price movement.
- Do not increase risk after a losing streak to recover quickly.
- Review performance over a sample of trades, not after one win or one loss.
🎯 Precision Forex Tools for Confident Trading Decisions
❓ Swing Trading Indicator FAQs
What is the best swing trading indicator for Forex?
There is no universal best indicator. Moving averages, RSI, MACD and ATR are among the most useful because they measure trend, momentum and volatility. The best choice depends on your strategy and market condition.
Can I use only one indicator?
Yes, but it is usually better to combine one indicator with price structure. For example, a moving average signal near support or resistance is more meaningful than a signal in isolation.
Which timeframe is best for swing trading?
Many Forex swing traders use the daily chart for direction and the 4-hour chart for entries. This combination can reduce noise while still offering practical trade timing.
Are swing trading indicators reliable?
Indicators are reliable only when used correctly. They should support a tested plan, not replace analysis, risk management or discipline.
Is RSI good for swing trading?
RSI can be very useful for identifying momentum shifts, pullbacks and divergence. It works best when combined with trend direction and support/resistance.
How many indicators should I use?
Two or three well-chosen indicators are usually enough. A clean setup might include a moving average for trend, RSI or MACD for momentum and ATR for volatility.
🏁 Final Thoughts: The Indicator Is Only One Part of the Edge
A swing trading indicator can be a powerful ally when it is used with structure, patience and proper risk management. Moving averages can define direction, RSI and MACD can confirm momentum, Bollinger Bands can reveal volatility conditions and ATR can improve stop placement.
But no indicator removes uncertainty. The real edge comes from combining technical tools with market structure, disciplined execution, careful position sizing and consistent review. In Forex swing trading, the goal is not to win every trade. The goal is to build a repeatable process that can survive losing periods and capitalize when conditions align.
Trade the plan, manage the risk and let the indicators support your decisions — not control them.
Disclaimer: Trading Forex and CFDs involves risk and may not be suitable for every trader. This article is for educational purposes only and does not provide financial advice, investment recommendations or a guarantee of trading results. Always test strategies carefully and use risk controls that match your account size and experience.
📌 More Free Indicators and Trading Systems for MT4 or MT5
- Top-Rated MetaTrader Indicators


- 3 Bars High/Low Indicator

- Footprint Indicator: The…

- Valid Swing High Low Indicator

- Profitable Forex Indicator:…

- Vinin HighLow Indicator

- MTF High Low Indicator for MT5

- Mastering RSI in Forex…

- The Smart Money Indicator…

- I-High Low Indicator

- Mastering the SuperTrend…

- The Hidden MACD Indicator…

- High Low Flat Channel Indicator

- Average Change High Low Indicator

- The Best Indicator for…

- Previous Highs and Lows Indicator

- Spead High Low Indicator

- High Low Zigzag Indicator

- MACD MTF with High/Low…

- High Low Next Activator Indicator

- High Low Activator Profit Indicator

- Premium Indicators for MT4 and MT5