The Volume Profile Indicator is one of the most useful tools a Forex trader can bring to a chart when the goal is to understand where real trading interest has built up. A standard volume indicator shows activity across time. Volume Profile shows activity at price. That difference changes the way you read a market.
After more than two decades of watching currency pairs move through quiet ranges, aggressive breakouts, failed retests, and messy reversals, I have learned that price alone rarely tells the whole story. A candle tells you where price opened, closed, and travelled. Volume Profile helps you judge where the market accepted price, where liquidity collected, and where price may react again when it comes back.
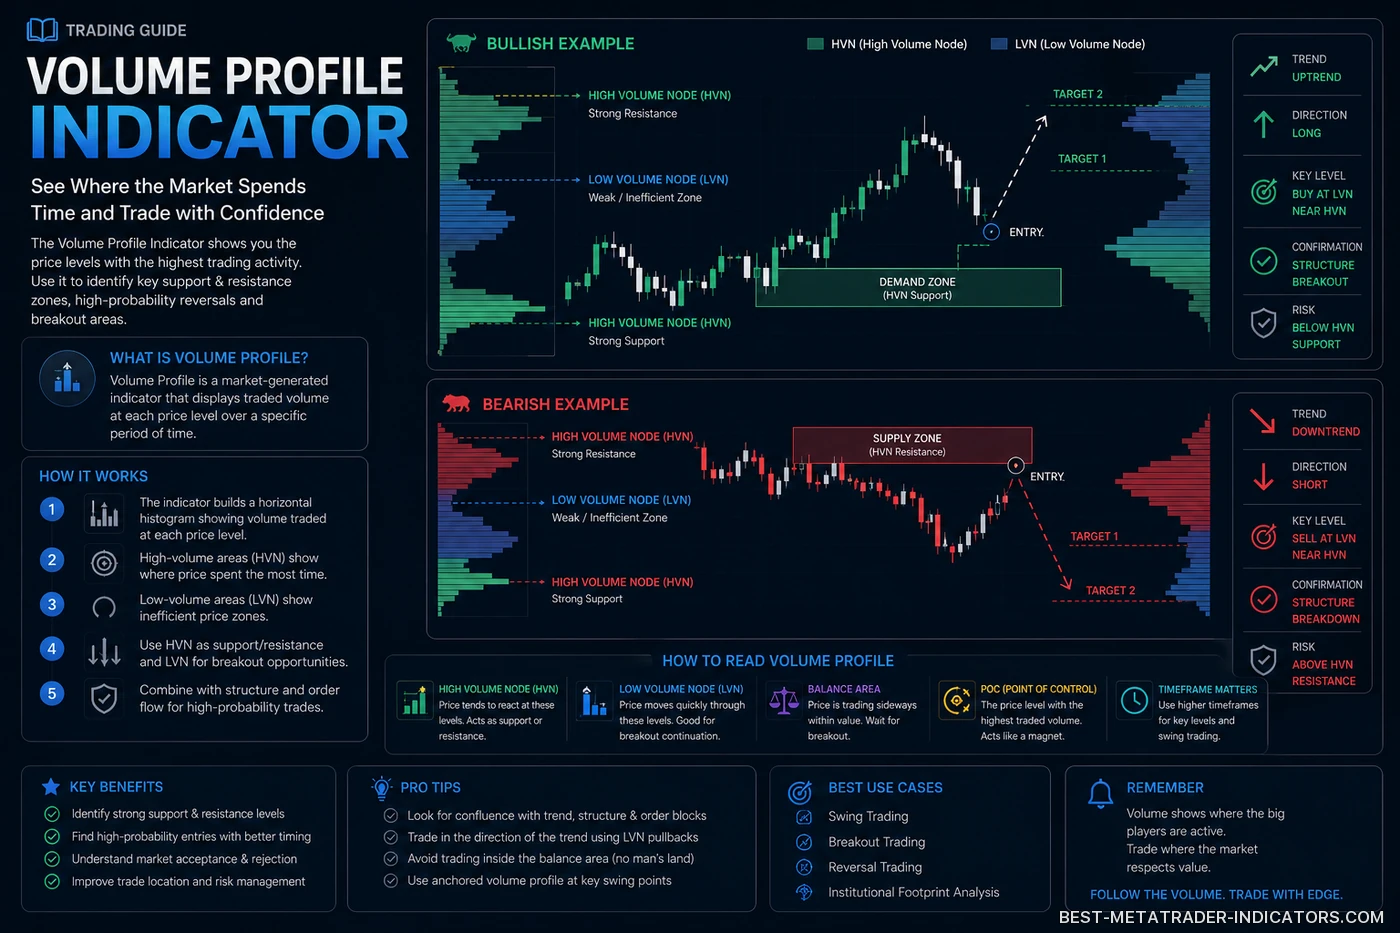
🧠 What Is the Volume Profile Indicator?
The Volume Profile Indicator is a charting tool that displays traded volume at specific price levels over a chosen period. Instead of printing volume as vertical bars below the chart, it draws horizontal bars along the price axis, so the trader can see which prices attracted the most activity.
In simple terms, it answers one practical trading question:
Where did the market do the most business? That is the core idea behind Volume Profile. It highlights the price zones where buyers and sellers were most active, and those zones often become useful reference points later.
For Forex traders, this matters because spot FX does not trade on one centralized exchange. Most MetaTrader platforms work with tick volume or broker-based volume data. It is not the same as centralized exchange volume, but it can still give a clear read on participation, activity, and market structure when used with sensible expectations.
📌 Key Volume Profile Terms Every Forex Trader Must Know
POC
Point of Control is the price level with the highest recorded volume during the selected session or range. Price often returns to it because it represents a level where the market previously found balance.
Value Area
The value area usually represents the zone where approximately 70% of the selected volume occurred. It shows where the market accepted price instead of rejecting it quickly.
Low Volume Node
A low volume node is a price area with limited trading activity. Price often moves quickly through these pockets because there was less historical interest to slow it down.
| Term | Meaning | Trading Use |
|---|---|---|
| POC | Highest volume price level | Potential support, resistance, or price magnet |
| VAH | Value Area High | Upper edge of accepted value |
| VAL | Value Area Low | Lower edge of accepted value |
| HVN | High Volume Node | Consolidation, acceptance, possible reaction zone |
| LVN | Low Volume Node | Fast price movement, breakout path, rejection area |
⚙️ How Volume Profile Works in Forex Trading
Volume Profile divides a selected price range into smaller price levels and then estimates how much trading activity occurred at each level. The result is a horizontal histogram that sits directly beside price, which makes the information easy to compare with market structure.
The longest bars show where the market spent the most effort. Shorter bars show price levels where the market did not trade much. Together, these areas create a practical map of acceptance and rejection.
Important: In spot Forex, Volume Profile is usually based on tick volume or broker feed data. Do not treat it as perfect institutional order flow. Treat it as a practical market participation map that needs confirmation from price action.
🎯 Why Professional Traders Use Volume Profile
Many traders rely only on support and resistance lines, moving averages, or trendlines. Those tools can be useful, but they often miss the deeper question: where did the market actually agree on price?
Volume Profile helps answer that question by identifying price zones where the market previously showed strong interest. When price returns to those areas, the reaction can tell you whether value is being respected, rejected, or rebuilt.
Better Context
Volume Profile helps separate random price movement from areas of real market participation.
Cleaner Trade Planning
It can help traders define entries, exits, stop-loss zones, and profit targets with more structure.
Useful for All Timeframes
Scalpers, intraday traders, swing traders, and position traders can all use Volume Profile with different session ranges.
Market Acceptance
It shows where price was accepted and where price was rejected, which is often more useful than a simple horizontal line.
📈 Volume Profile vs Traditional Volume Indicator
Both tools measure activity, but they answer different trading questions.
| Feature | Traditional Volume | Volume Profile | Best Use |
|---|---|---|---|
| DisplayHow it appears | Vertical bars below the chart | Horizontal bars beside price | Use both for confirmation |
| Main QuestionWhat it answers | When did volume happen? | Where did volume happen? | Volume Profile gives price-level context |
| Support/ResistanceZone detection | Limited | Strong | Identify high-volume reaction areas |
| Breakout AnalysisMomentum context | Good for timing | Good for structure | Combine with price action |
🛠️ Practical Volume Profile Settings
There is no universal setting that works for every trader. The best setup depends on your market, timeframe, session, and trading style. Still, these practical guidelines are a solid starting point for MetaTrader users and discretionary traders.
Scalping
Use session-based profiles such as London, New York, or the current trading day. Focus on intraday POC, VAH, and VAL.
Day Trading
Use daily and previous-day profiles. Watch reactions around previous POC and value area boundaries.
Swing Trading
Use fixed range profiles over major impulse moves, consolidations, and weekly ranges.
🚀 Strategy 1: POC Rejection Trade
The POC often represents the fairest price of a selected period. When price returns to the POC, traders should watch carefully for acceptance or rejection instead of assuming the level will hold automatically.
- Mark the previous session or range POC.
- Wait for price to return to that level.
- Look for rejection candles, failed breaks, or momentum loss.
- Enter only after confirmation, not blindly at the level.
- Place the stop beyond the rejection structure.
- Target the opposite side of value or the next liquidity zone.
Trader’s note: A POC is not automatically support or resistance. It becomes useful when combined with price action, session context, and disciplined risk management.
⚡ Strategy 2: Value Area Breakout
The value area shows where the market accepted price. When price breaks above the Value Area High or below the Value Area Low, it may signal that the market is searching for a new value zone.
How to Trade It
- Identify VAH and VAL from the previous session.
- Wait for a clean break outside the value area.
- Do not chase the first candle; wait for a retest or continuation setup.
- Confirm with market structure, trend direction, and momentum.
- Use low volume nodes as potential fast-move zones.
Best condition: This strategy works best when the breakout aligns with higher-timeframe direction and appears during an active trading session such as London or New York.
🔄 Strategy 3: LVN Fast-Move Setup
Low Volume Nodes are areas where price previously moved quickly or where little business was done. When price enters an LVN, it can sometimes move rapidly through that area again.
This is especially useful for breakout traders. Instead of taking profit too early, a trader can use the LVN as a potential acceleration zone while still managing risk around nearby structure.
Entry Idea
Look for a breakout from a high-volume area into a low-volume pocket. The move may accelerate if liquidity is thin.
Exit Idea
Take partial profits near the next high-volume node, previous POC, or major session level.
🧩 Strategy 4: Volume Profile With Support and Resistance
Traditional support and resistance become more powerful when they align with Volume Profile levels. A horizontal level that also overlaps with a high-volume node is usually more important than a random line drawn across the chart.
- Mark obvious swing highs and swing lows.
- Add the Volume Profile to the same price range.
- Look for confluence between structure and HVNs.
- Avoid taking trades at levels with no supporting context.
- Use candlestick confirmation before entering.
🕒 Best Forex Sessions for Volume Profile Analysis
Volume Profile becomes more useful when applied to active sessions. In Forex, the London and New York sessions usually provide the cleanest intraday opportunities because liquidity and volatility are higher.
| Session | Typical Use | Volume Profile Tip |
|---|---|---|
| Asian Session | Range building, quieter markets | Use the range as a reference for London breakout levels |
| London Session | Trend initiation and breakout trading | Watch breaks from Asian value areas |
| New York Session | Continuation, reversal, and volatility expansion | Compare New York profile with London POC and value |
| London/New York Overlap | High liquidity and stronger movement | Best time to watch value area breaks and LVN moves |
✅ Volume Profile Trading Checklist
Before placing a trade with Volume Profile, go through this checklist. It can prevent emotional entries and improve trade quality, especially when the chart looks tempting but the setup is not fully formed.
- Have I selected the correct profile range?
- Is price reacting at POC, VAH, VAL, HVN, or LVN?
- Does the setup align with higher-timeframe structure?
- Is the current session active enough for this trade?
- Do I have confirmation from price action?
- Is my stop-loss placed beyond invalidation, not randomly?
- Is the reward-to-risk ratio acceptable?
- Am I trading the setup, or am I chasing price?
💡 Advanced Tips From Professional Trading Experience
Use Previous Session Levels
Previous day POC, VAH, and VAL can act as powerful reference points for the next session.
Do Not Overload the Chart
Too many profiles create confusion. Focus on the most relevant range: current session, previous session, or major swing.
Combine With Market Structure
Volume Profile is stronger when it confirms trend direction, break of structure, or a clear liquidity sweep.
Respect Abnormal Volatility
Sharp volatility spikes can cut through clean technical levels. When spreads widen or candles expand aggressively, reduce size, wait for structure, or stand aside.
⚠️ Common Volume Profile Mistakes
Volume Profile is powerful, but many traders use it incorrectly. The biggest mistake is treating every profile level as a guaranteed reversal point instead of reading how price behaves when it reaches the area.
- Entering blindly at POC: Always wait for confirmation.
- Using random profile ranges: The selected range must make logical market sense.
- Ignoring trend direction: A strong trend can push through profile levels easily.
- Overcomplicating the chart: Too many profiles reduce clarity.
- Forgetting risk management: No indicator removes the need for a stop-loss.
📋 Simple Volume Profile Trading Plan
Here is a practical trading plan that Forex traders can adapt to their own style:
- Start with higher timeframe bias: Identify whether the market is trending, ranging, or reversing.
- Mark key profile levels: Previous POC, VAH, VAL, HVNs, and LVNs.
- Wait for price to reach a level: Do not trade in the middle of nowhere.
- Look for confirmation: Rejection, breakout, retest, or continuation pattern.
- Define invalidation: Know exactly where the trade idea is wrong.
- Manage the trade: Take partial profits near the next profile level and trail only when structure supports it.
🔍 Best Currency Pairs for Volume Profile
Volume Profile can be used on most liquid Forex pairs. It is usually cleaner on major pairs because they tend to have tighter spreads, higher liquidity, and more reliable intraday structure.
| Pair | Best Trading Style | Volume Profile Use |
|---|---|---|
| EUR/USD | Scalping, day trading, swing trading | Excellent for session profiles and value area breaks |
| GBP/USD | Intraday momentum trading | Useful for London and New York volatility |
| USD/JPY | Trend and breakout trading | Works well around high-volume consolidation zones |
| AUD/USD | Session-based trading | Useful when comparing Asian and London value areas |
🧭 Volume Profile and Risk Management
The best traders do not use indicators to predict the future. They use tools to organize probabilities. Volume Profile should help you plan better trades, not convince you to risk more.
Risk rule: Never increase position size only because a Volume Profile level looks strong. A strong level can still fail. Your risk must always be defined before entry.
Use Volume Profile levels for logical stop-loss placement and target selection. For example, if you buy a rejection from VAL, your invalidation may sit below the rejection swing or below the value area. Your target may be POC, VAH, or the next high-volume node.
🧪 Volume Profile Strategy Ideas to Test
Before using any strategy with real money, test it across multiple pairs, timeframes, and market conditions. Here are several ideas worth backtesting in MetaTrader or in your preferred trade journal:
Previous Day POC Retest
Test how often price reacts when returning to the previous day’s POC during London or New York.
Asian Range Value Break
Build a profile around the Asian session and trade London breakouts from the Asian value area.
LVN Continuation
Test whether price accelerates after breaking from an HVN into a nearby low-volume zone.
Weekly Value Rotation
Use weekly profiles to identify whether price is rotating inside value or attempting to establish new value.
📝 Quick Notes for Daily Trading
- Volume Profile works best when the selected range has a clear market logic.
- Previous session levels are often more useful than random intraday profiles.
- High-volume nodes can attract price, but they can also slow price down.
- Low-volume nodes can create fast moves, but false breakouts are common.
- POC is important, but it is not magic.
- Context is everything: trend, session, structure, liquidity, and volatility conditions matter.
❓ Volume Profile Indicator FAQ
Is Volume Profile useful in Forex?
Yes, but it must be used correctly. Since spot Forex is decentralized, most platforms use tick volume or broker-based data. It is still useful for reading participation and structure.
What is the most important Volume Profile level?
The POC is often the most watched level because it shows where the most volume occurred. However, VAH, VAL, HVNs, and LVNs are also important.
Can beginners use Volume Profile?
Yes, but beginners should start simple. Focus first on POC, Value Area High, and Value Area Low before adding advanced concepts.
Does Volume Profile predict price direction?
No indicator predicts price with certainty. Volume Profile provides context. The trader must combine it with price action, structure, and risk management.
Which timeframe is best?
For intraday trading, session and daily profiles are useful. For swing trading, fixed range and weekly profiles often provide better context.
Should I use Volume Profile alone?
No. It works best when combined with market structure, support and resistance, liquidity concepts, candlestick confirmation, and disciplined risk control.
🏁 Final Thoughts
The Volume Profile Indicator is not a magic trading system, but it is one of the better tools for understanding where the market has shown real interest. It helps Forex traders identify value, rejection, acceptance, and potential reaction zones.
Used correctly, Volume Profile can improve trade planning, reduce emotional decisions, and create a more professional approach to chart analysis. Used incorrectly, it becomes just another confusing indicator on an already crowded chart.
The goal is simple: do not trade every level. Trade the best levels, in the right context, with confirmation and controlled risk.
Risk Disclaimer: Forex trading involves substantial risk and is not suitable for every investor. The information in this article is for educational purposes only and should not be considered financial advice.