🏷️ Premium Indicators for Beginners and Experts ↩️
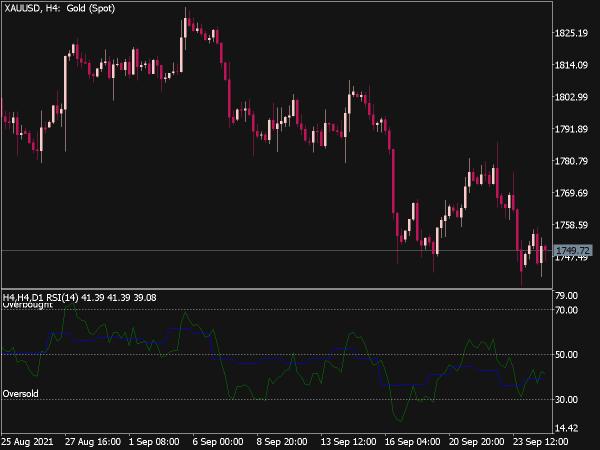
Popular RSI Indicators for MT5 🖇️
Submit your review | |
It should be noted that, despite the name Relative Strength Index, this oscillator has nothing to do with relative strength (RS), which is a very important indicator for stocks, commodities and intermarket analysis. The formula is:
100 – (100 : 1 + (U / D))
Where U is the price change in the uptrend and D is in the downtrend.
With RSI, there are usually several divergences, so that the divergence signals are quite complicated to evaluate here.
Trend lines and formations
Formations are relatively rare here, on the other hand, the trend lines are very important, they can often be drawn sensibly and trend line breakthroughs should always be noted. Also resistance and support zones, in general the whole range of instruments of chart analysis can be used well here. It is particularly important that the RSI has the property that it usually breaks through its trend lines earlier than the prices. This is probably the most important application form for the RSI.
Different variants
Dynamic Momentum is an RSI weighted by the volatility of the last five days. It is from Chande. The interpretation is essentially the same as for the RSI, but the indicator is much faster, so it has the advantage that it often has a lead before the prices and can thus be used favorably to assess possible breakouts.
Sideways movements
One can often predict the breakout from a sideways movement by paying attention to the course of the RSI. If this rises, for example, which means that higher lows form in the course of the sideways movements, the breakout will usually happen upwards. However, if lower highs form in the course of the sideways movement, the breakout will go down.
This is a relatively unknown property of the RSI. The forecast turns radically in the other direction if this formation fails on the basis of a trend line break: for example, suppose that during a sideways movement in the price, the RSI would have formed a sequence of higher highs, which is a bullish signal. If he were to break the trend line below these bottoms down now, the signal would not only be bearish, but strongly bearish.
Remarks
Despite the popularity, it must be said that there are now better oscillators. The RSI is relatively low, as it is slow and wanders around in the midfield for a very long time. So if you want to use it, you should focus on its two strengths:
He gives good formations, especially resistance and support lines, as well as trend lines.
It has a slightly different idea than most other oscillators and is therefore partly suitable to be combined with them, because then the probabilities add up.
The RSI as a long-term indicator
As soon as the RSI falls below 20 on monthly charts, it is an extreme situation that rarely occurs and indicates a bottoming out. In extreme situations, values of 16 or 15 can be achieved. Usually this is followed by a sharp backlash, but the RSI is just not useful for timing.
More Great MetaTrader Indicators 📌
- Most Popular MT4 Indicators

- Non-Repainting and Non-Lagging Systems

- Best MT5 Color Chart…
 - The TOP 10 for MetaTrader 5")
- RSI Bollinger Bands Arrow…

- RSI Min Max Levels MTF Indicator

- Exclusive Mtf Rsi Swing…

- Advanced Step RSI V2.1 &…

- RSI HMA Min Max Levels MTF…

- RSI HMA on Chart MTF Indicator

- Double Stochastic RSI MTF Indicator

- DSL All RSI MTF Indicator

- RSI Smoothed MTF Alerts Lines

- RSI Bollinger Bands Lines…

- Average True Range (ATR)…
 MTF Indicator")
- Moving Average RSI MTF Indicator

- Relative Strength Index…
 MTF Indicator")
- 3 RSI Adaptive EMAs MTF Indicator

- Non Lag RSI NRP MTF Alerts…

- RSI MTF Indicator

- Most Popular MT5 Indicators