Submit your review | |
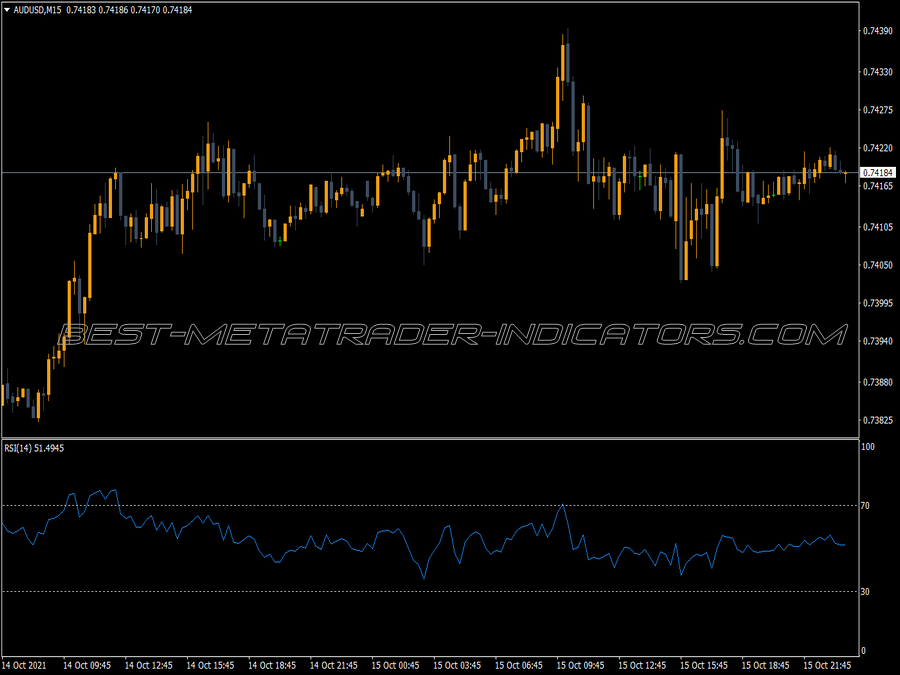
Relative Strength Index is a popular overbought-oversold indicator, developed by the famous indicator researcher and developer J. Welles Wilder. Its basis involves comparing the up-movements and the down-movements, to identify overbought and oversold periods in prices. It can be used both as trend-following indicator, and as a reversal picking indicator that identifies reversals.
Trading Method 1: Overbought-Oversold Method
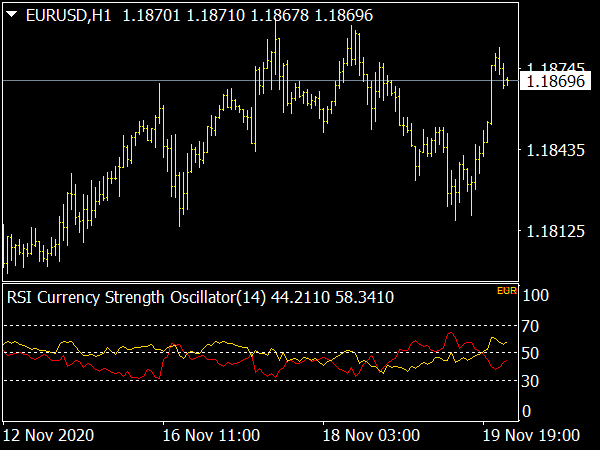
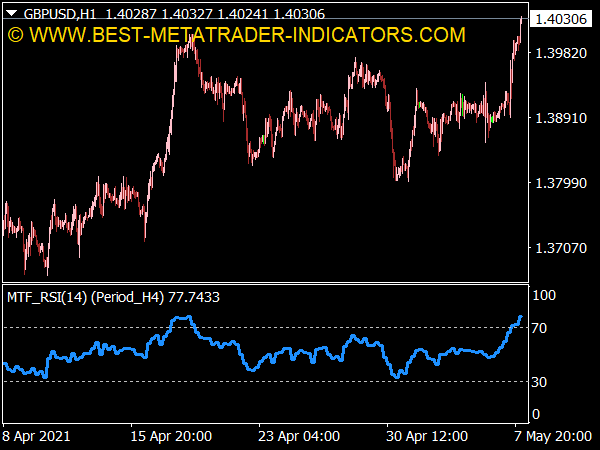
The basis of this method is cross of overbought and oversold levels of the Relative Strength Index. These levels are usually the 70 and 30 levels, where 70 is the overbought and 30 is oversold. Long trade is issued when the RSI crosses the oversold level from below. Short trade is issued when the RSI crosses the overbought level from above. The overbought-oversold trading method (contrarian approach) is the strongest trading method of the RSI. It produces high-quality signals that are usually predicting the reversal of trend.
Trading Method 2: 50-Line Cross
This is a trend-following method that involves the RSI. Its basis is the cross of the 50-level which is the center level of the indicator. A cross from below indicates a long entry, and a cross from above indicates a short entry. While the trend-following approach can produce profitable signals, it is considered relatively unreliable and is used in trading only with other filters and confirmations.
Trading Method 3: Divergence
The divergence is a classical trading method that is used with many indicators and oscillators. The idea behind divergences is a movement in price that does not correlate with the movement of the RSI. The RSI usually points to the "real" direction, and traders are expecting price to "correct" itself. It can be a highly powerful method if executed correctly.
The Relative Strength Index is a powerful indicator that is popular among traders in FOREX, Stocks and Commodities. There are several trading methods that employ it – each with its own strengths and weaknesses.

