Submit your review | |
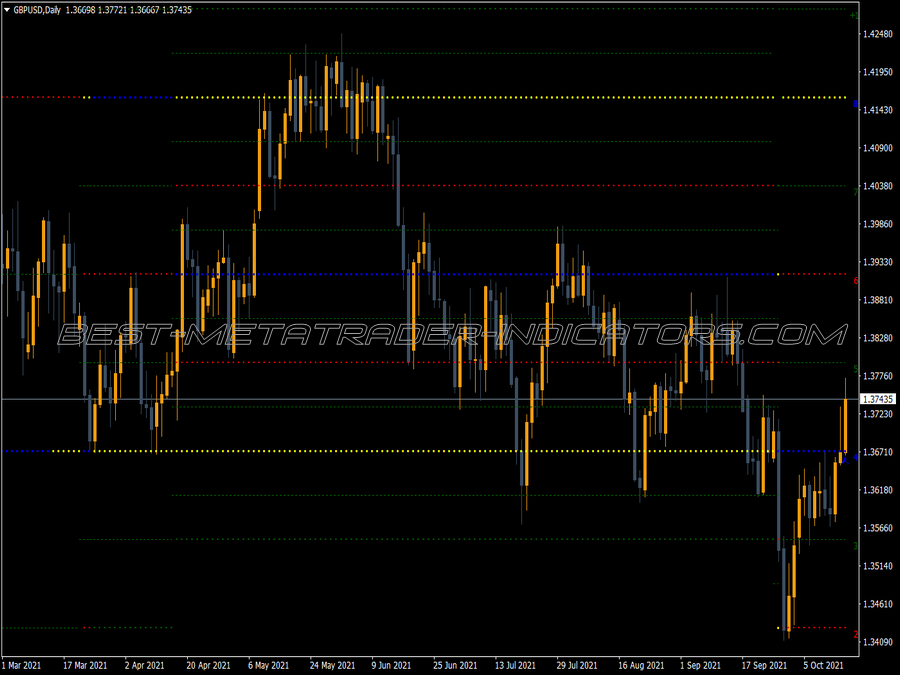
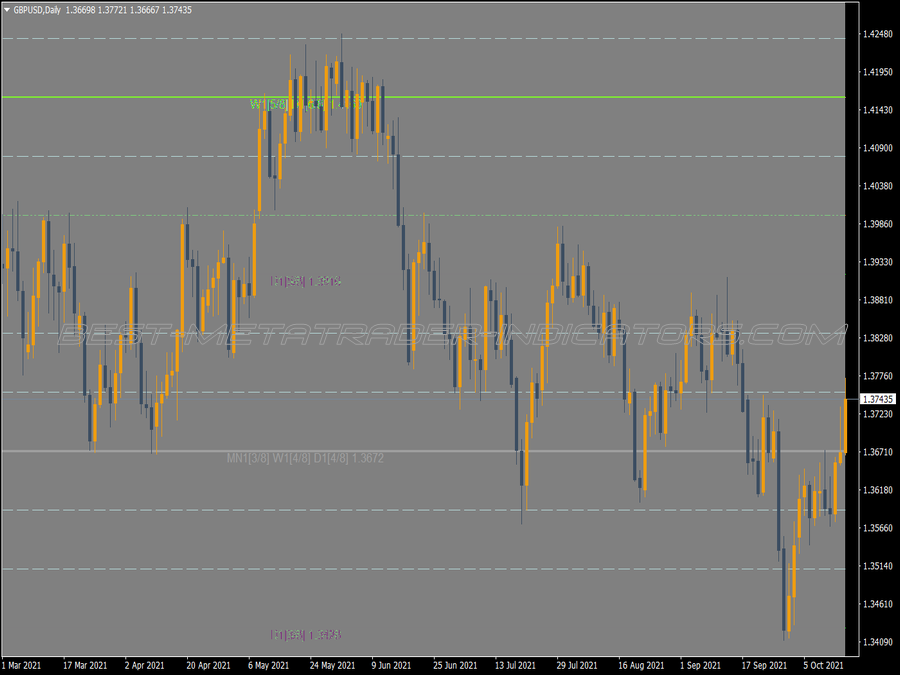
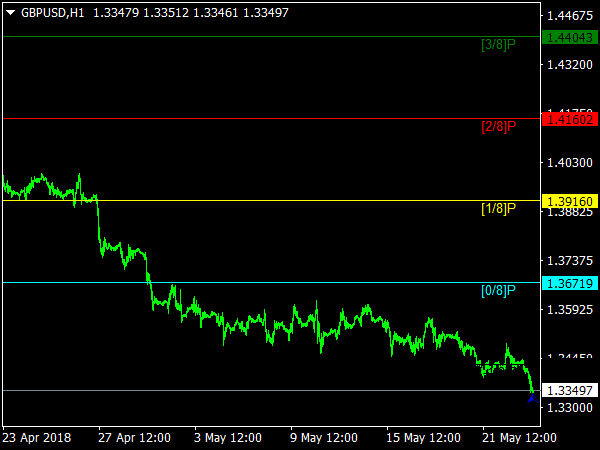
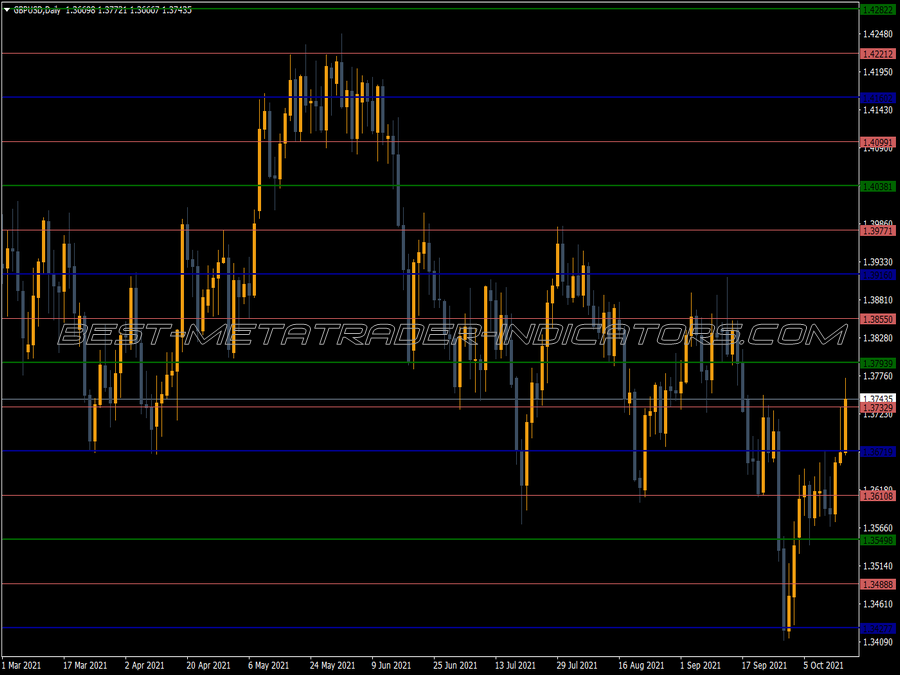
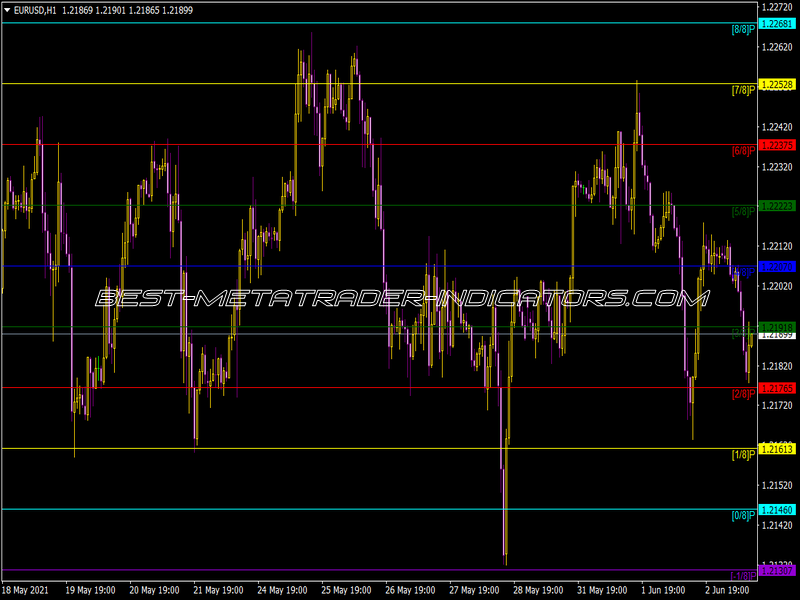
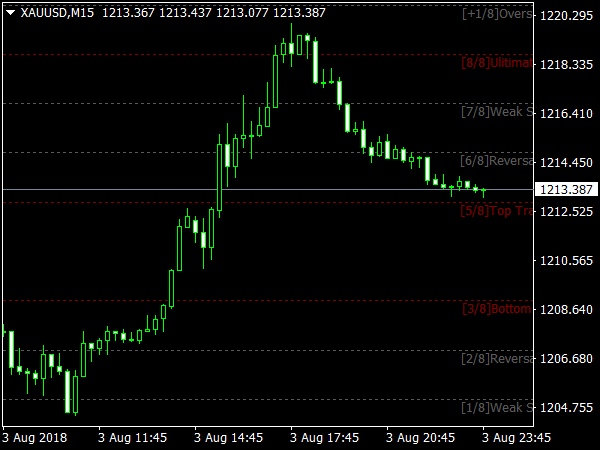
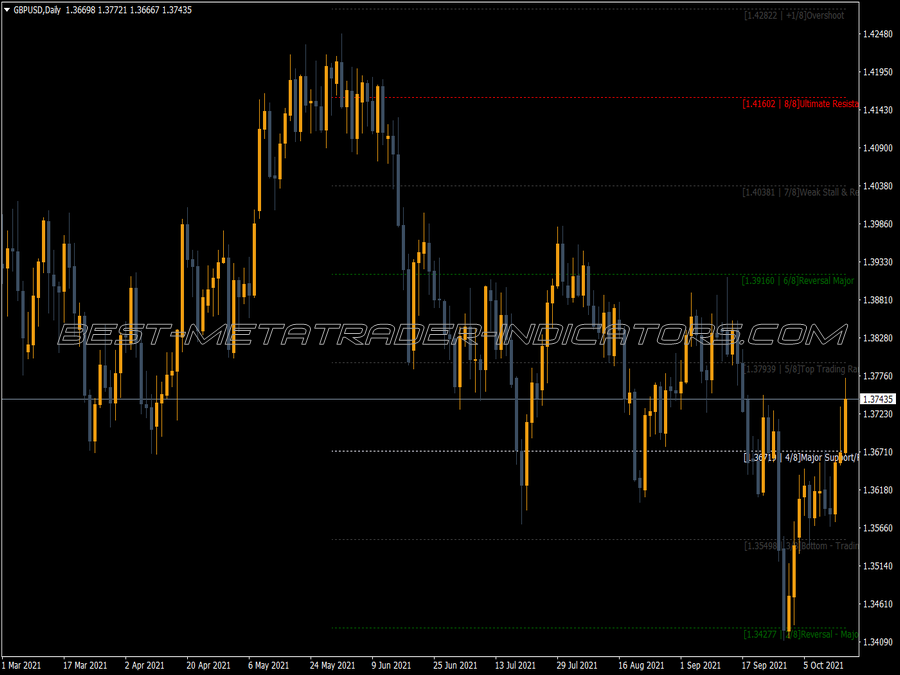
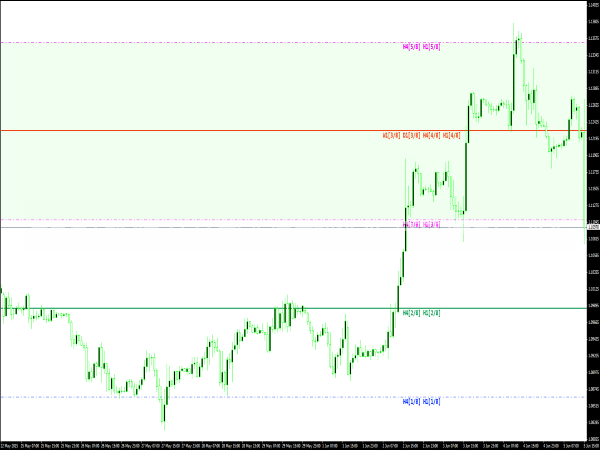
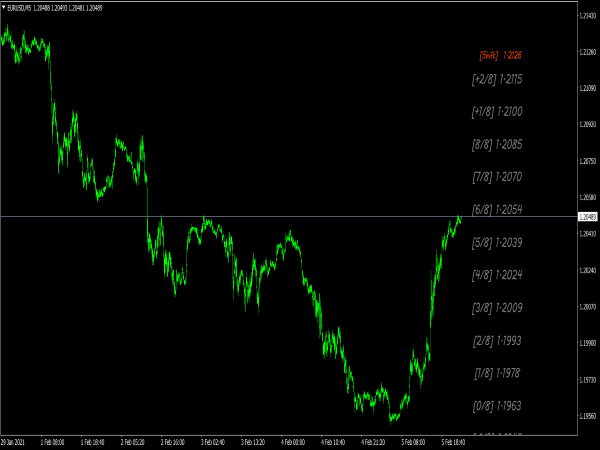
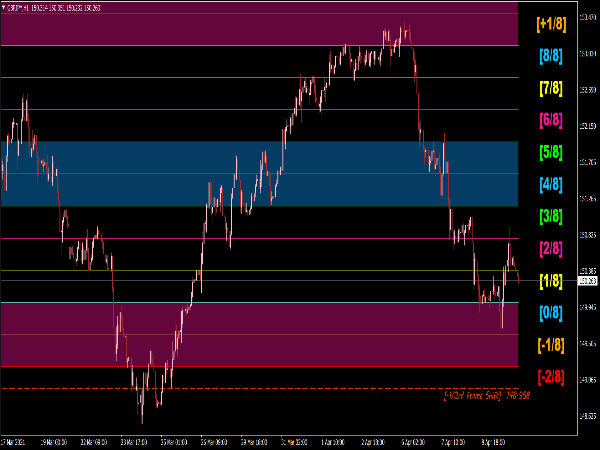
The Murrey Math Lines are part of Murrey Math trading system. Murrey Math Lines are similar to Fibonacci retracements and pivot points. These lines consist of 9 equidistant lines which are parallel to each another. Murrey Math Lines from the bottom are at the levels 0/8, 1/8, 2/8, 3/8, 4/8, 5/8, 6/8, 7/8 and 8/8.
T. Henning Murrey developed these line based on Gann's theory, Murrey Math improves upon traditional Gann analysis by providing a constant price range to divide into 1/8's, which act as points of price support and resistance. Each line has its own meaning and significance which is explained below.
8/8th and 0/8th Lines (Ultimate Resistance)
These lines are the hardest to penetrate on the way up, and give the greatest support on the way down.
7/8th Line (Weak, Stall and Reverse)
This line is weak. If prices run up too far too fast, and if they stall at this line they will reverse down fast. If prices do not stall at this line they will move up to the 8/8th line.
6/8th and 2/8th Lines (Pivot, Reverse)
These two lines are second only to the 4/8th line in their ability to force prices to reverse. This is true whether prices are moving up or down.
5/8th Line (Top of Trading Range)
The prices of any currency will spend 40% of the time moving between the 5/8th and 3/8th lines. If prices move above the 5/8th line and stay above it for 10 to 12 days, the currency is said to be selling at a premium to what one wants to pay for it and prices will tend to stay above this line in the "premium area". If, however, prices fall below the 5/8th line then they will tend to fall further looking for support at a lower level.
4/8th Line (Major Support/Resistance)
This line provides the greatest amount of support and resistance. This line has the greatest support when prices are above it and the greatest resistance when prices are below it. This price level is the best level to sell and buy against.
3/8th Line (Bottom of Trading Range)
If prices are below this line and moving upwards, this line is difficult to penetrate. If prices penetrate above this line and stay above this line for 10 to 12 days then prices will stay above this line and spend 40% of the time moving between this line and the 5/8th line.
1/8th Line (Weak, Stall and Reverse)
This line is weak. If prices run down too far too fast, and if they stall at this line they will reverse up fast. If prices do not stall at this line they will move down to the 0/8th line.
Use of Murrey Math Lines in trading
As mentioned in above description, these lines act as levels of support and resistance. One strategy for trading could be Buy when price touches the 1/8th line and exit when the price reaches 4/8th line, similarly we can buy when price touches 0/8th line and exit when it touches 2/8th line.
And for going short we can open a short position when price touches 7/8th line and exit when it touches 4/8th line, similarly we can sell when price touches 8/8th line and exit when it touches 6/8th line.
Hie, I found out about your Murrey Math Indicator on the internet a few days ago, but I realised your FW value is set to 800, would you help me understand what is FW about, as I checked other Murrey Math indicators are set to 64 on FW. Then the on the: 1/3rd Frame Shift, what is its importance? I searched on internet i can't find any infomation on FW and the 1/3rd Frame Shift. Will greatly appreciate your assistance on that.
Kind Regards,
Itumeleng

