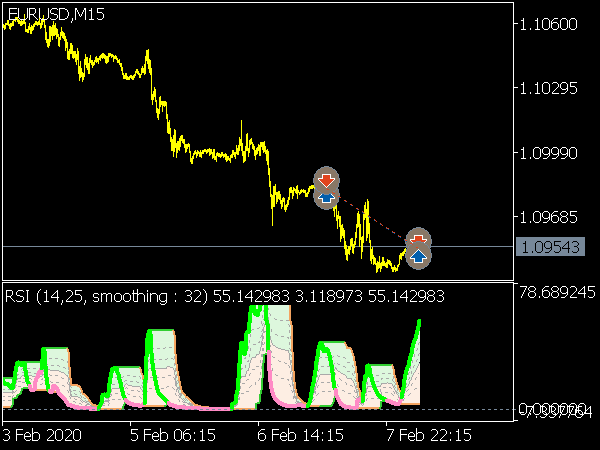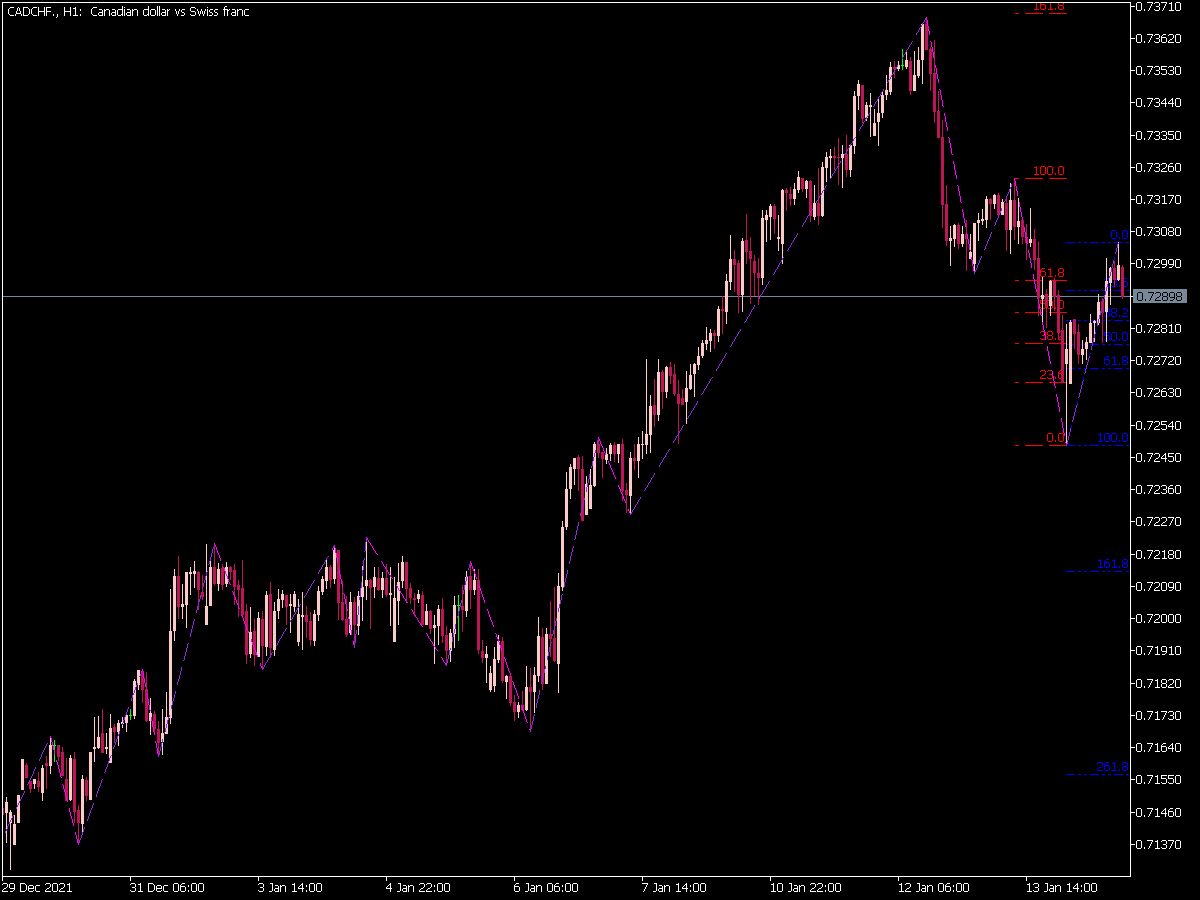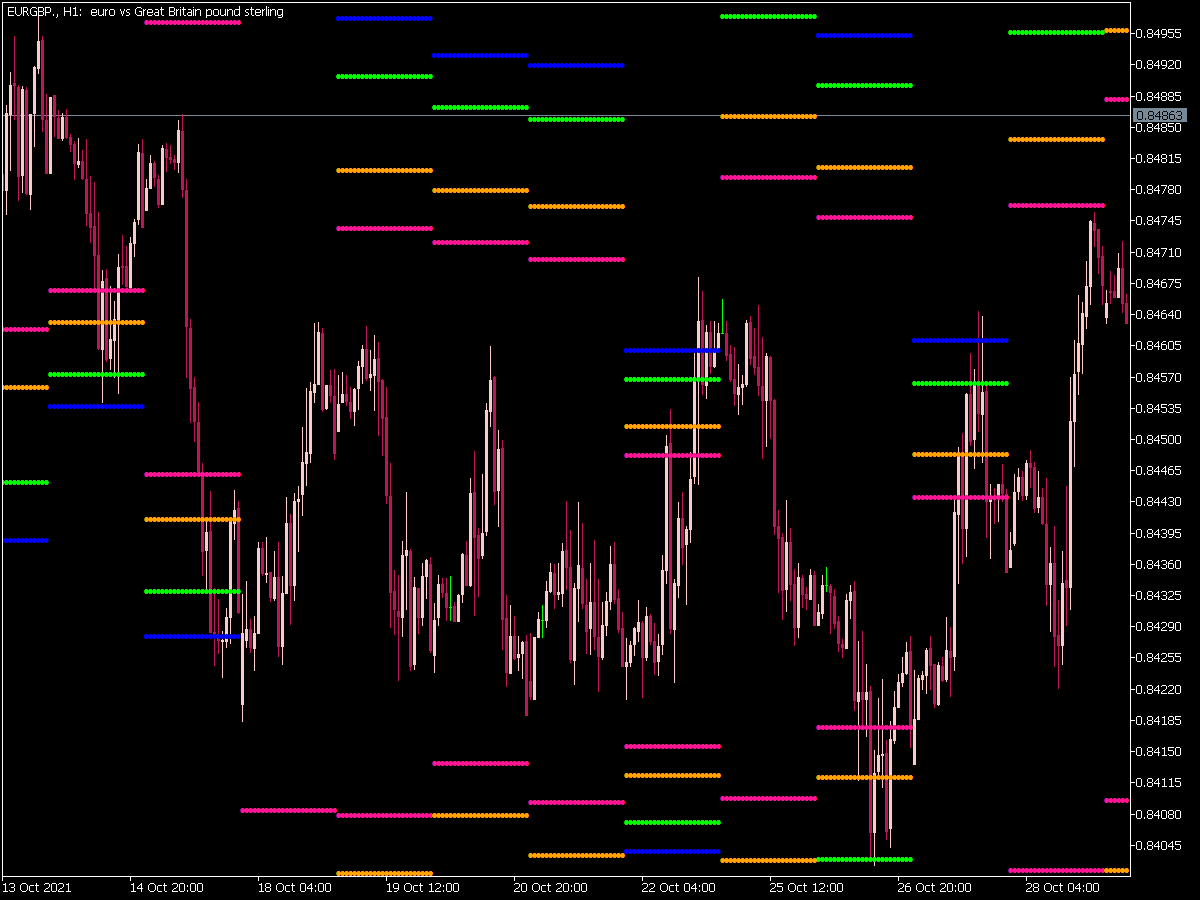
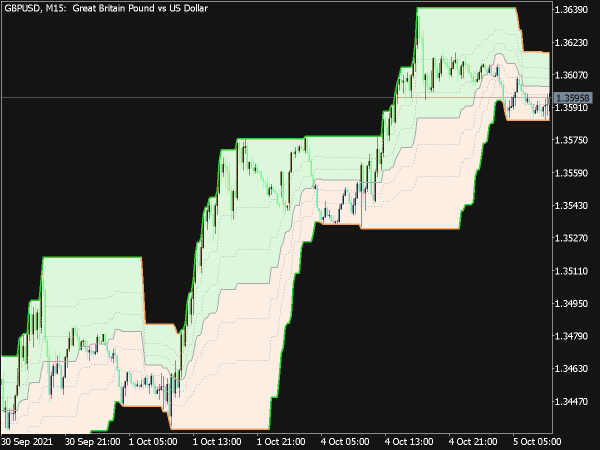
Donchian Fibo Clouds Indicator
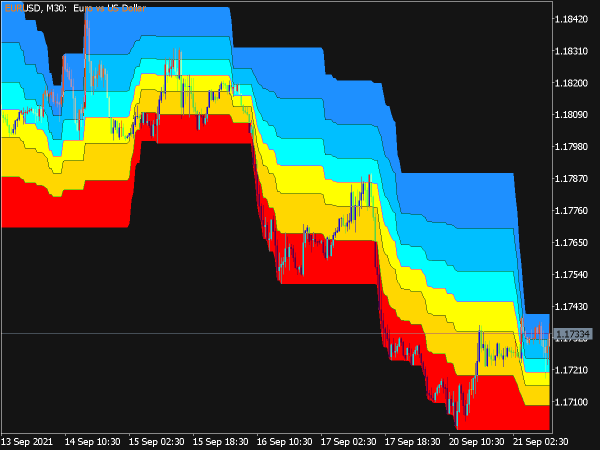
Candles Auto Fibo Grand XN
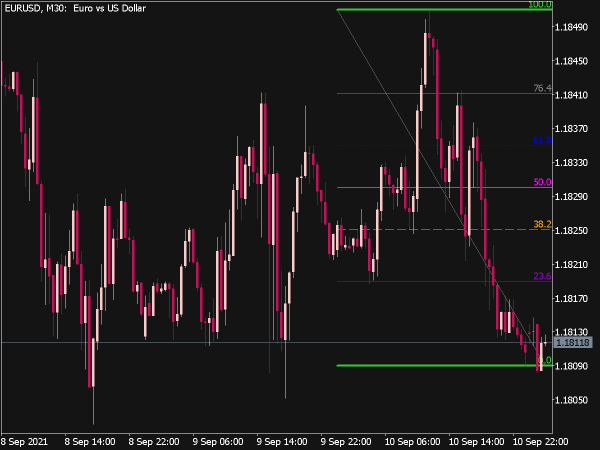
Fibonacci Auto Channel Inidcator
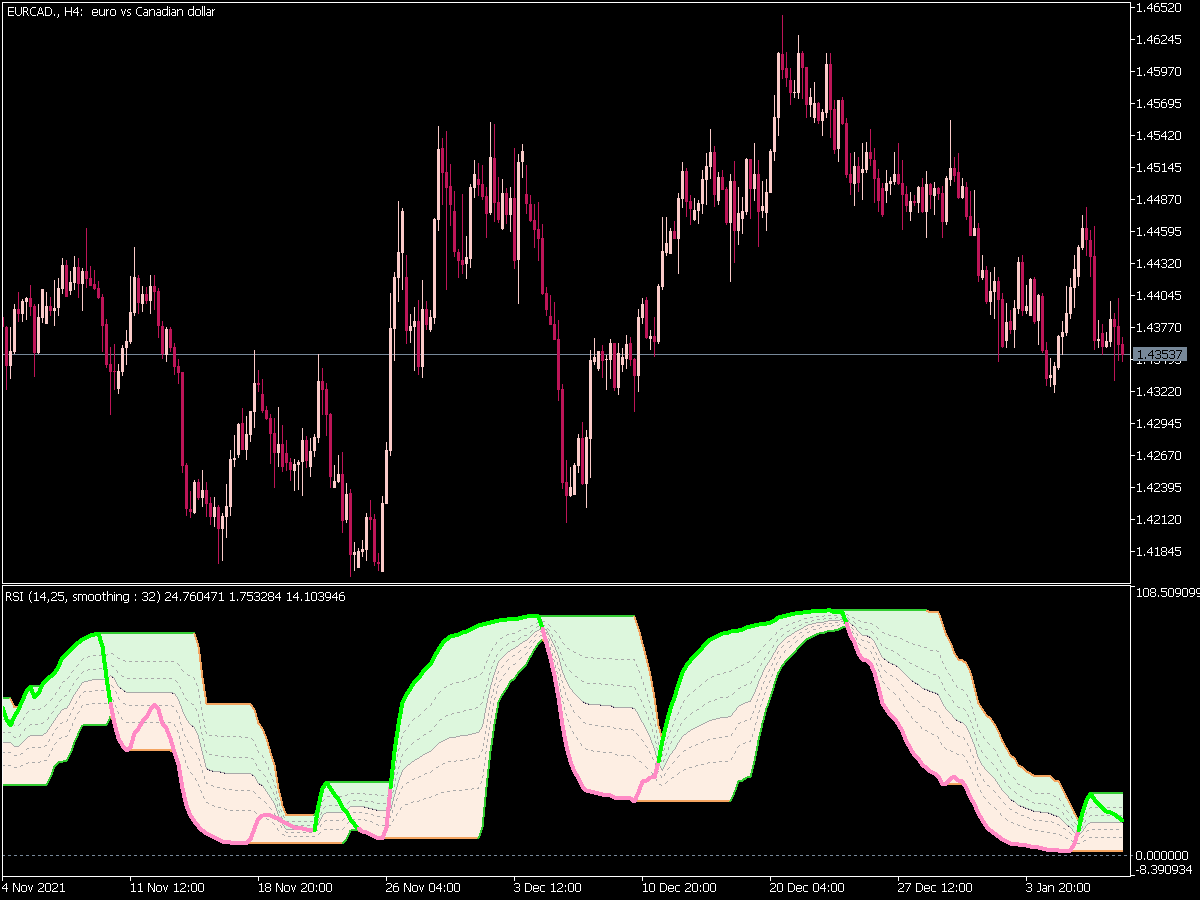
RSI with Fibonacci Auto Channel Indicator
How to Use Fibonacci Retracement Without Guessing the Next Move
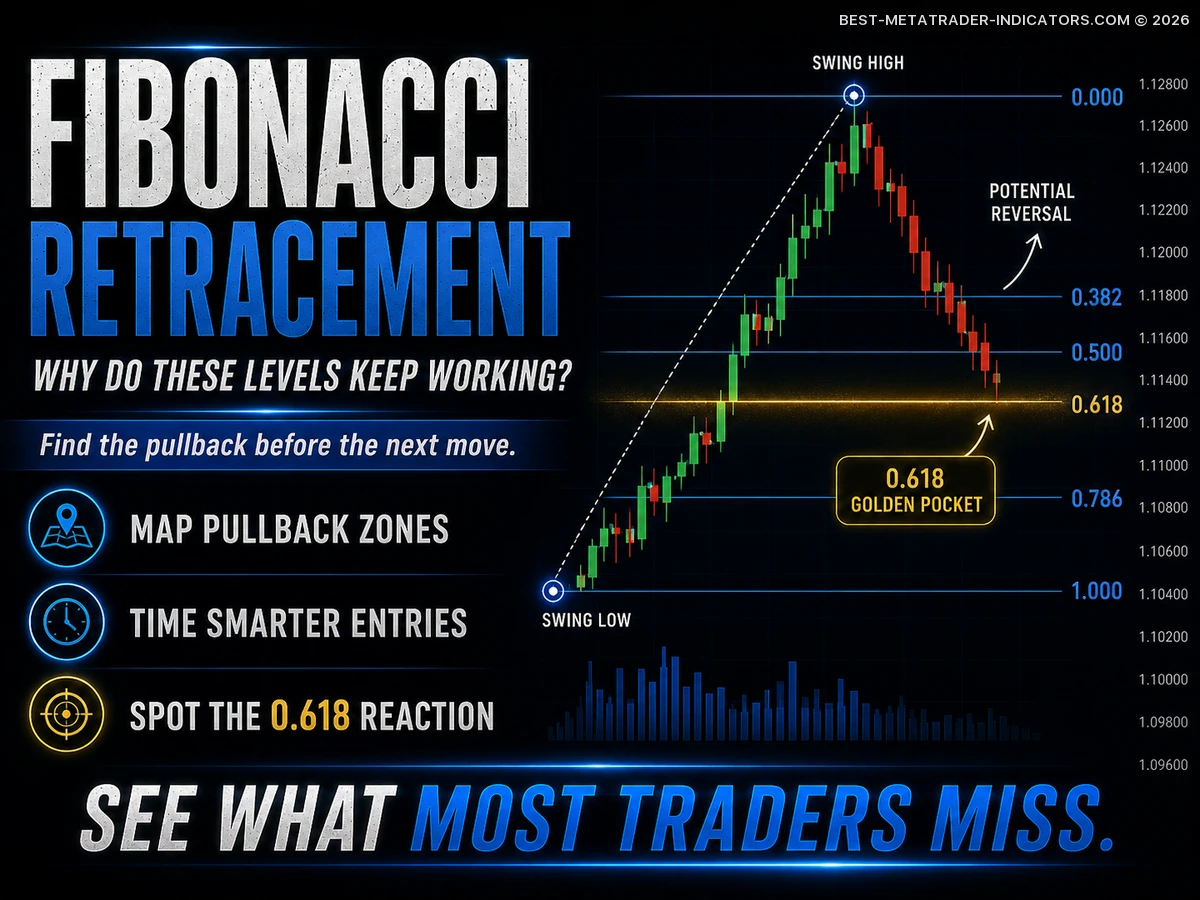
Fibonacci retracement is one of those tools that looks simple on the chart but only becomes useful when it is handled with discipline. Many traders draw the levels, wait for price to touch 38.2%, 50%, or 61.8%, and enter almost automatically. That is not analysis. That is guessing with clean-looking lines.
Used properly, Fibonacci retracement is not a prediction tool and not a shortcut to certainty. It is a structured way to judge where a trend may pause, pull back, and possibly continue. In Forex, where price usually moves through impulses, corrections, sweeps, and continuation legs rather than straight lines, this framework can help with entries, stop-loss placement, partial profits, and realistic trade management.