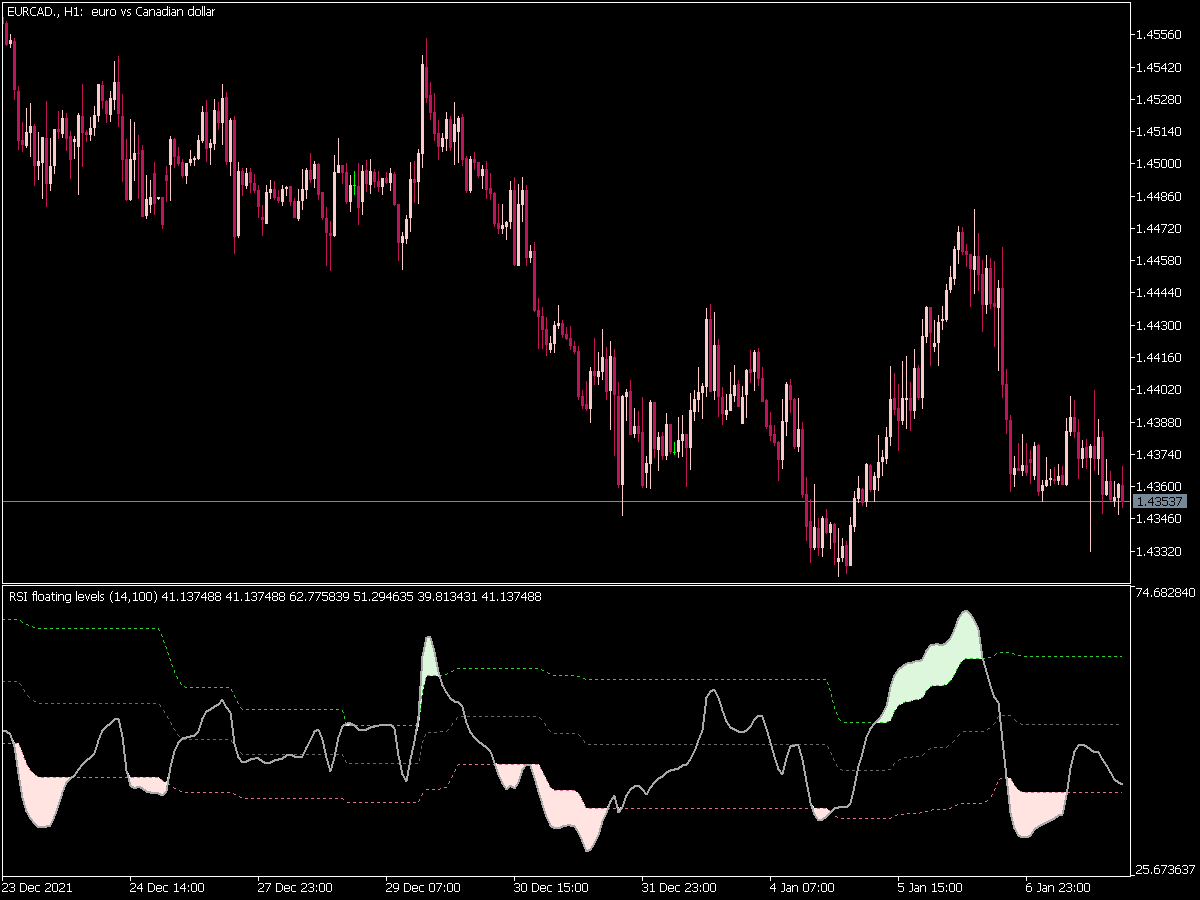
Fractal Levels System
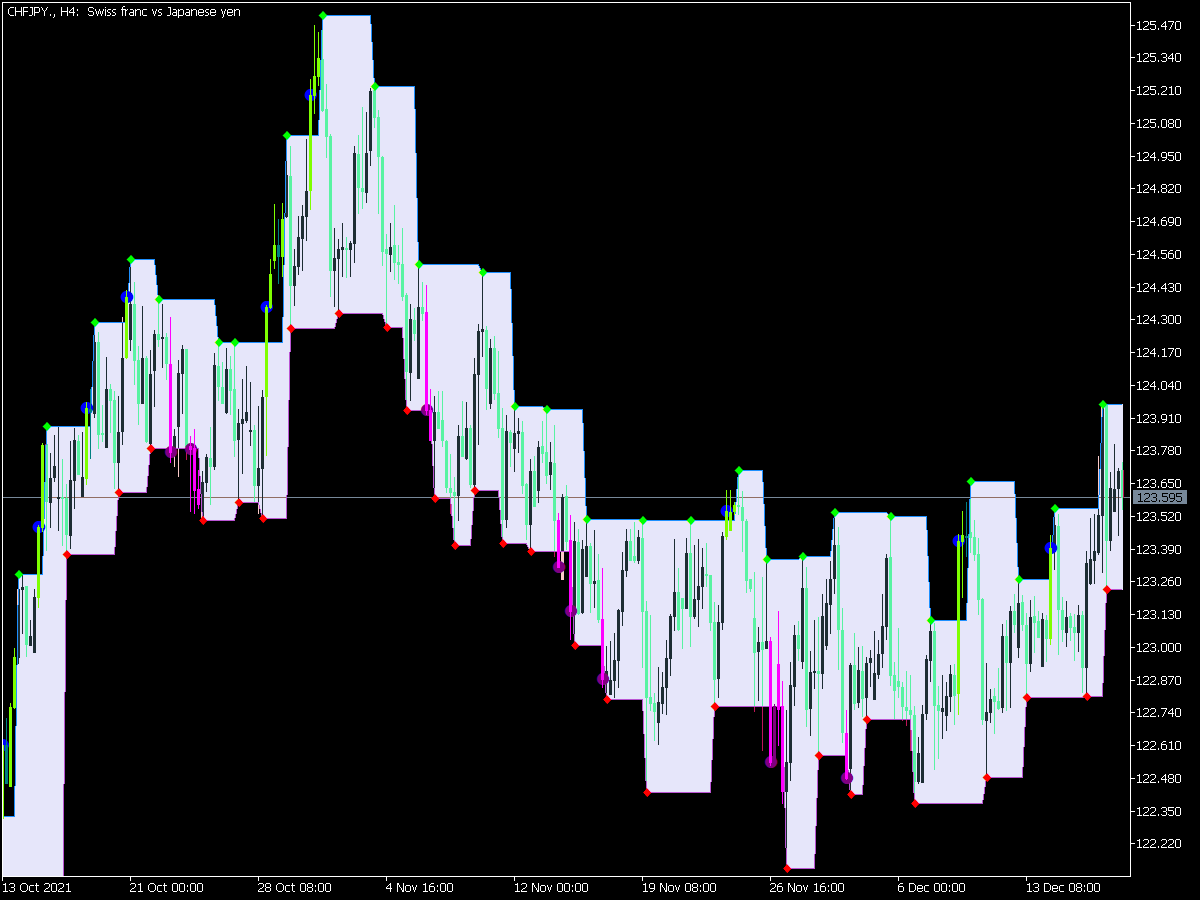
T3 Levels Indicator
Footprint Indicator: The Hidden Volume Tool Professional Traders Use
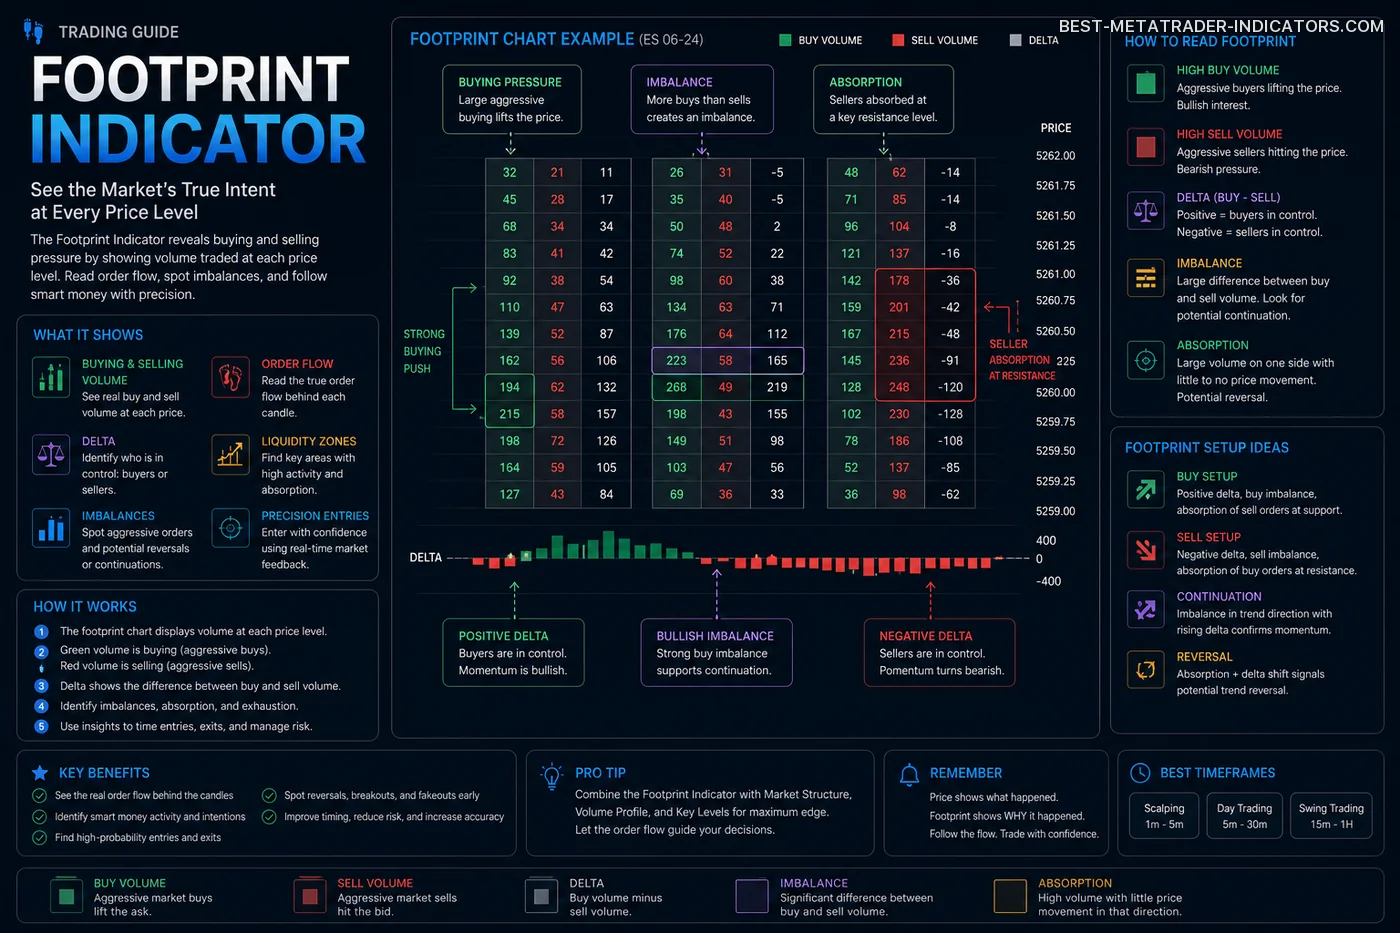
The footprint indicator is one of the most useful order-flow tools available to active traders. A standard candlestick shows the open, high, low, and close. A footprint chart goes deeper by showing how much volume traded at each price level, which side was more aggressive, and where buyers or sellers may have been caught on the wrong side of the move.
For Forex traders, especially those trading major pairs such as EUR/USD, GBP/USD, USD/JPY, XAU/USD, or index CFDs, footprint analysis adds a valuable layer of execution context. It does not predict the next candle on its own, but it can show whether a move is backed by real participation or is running mainly on thin liquidity and short-lived momentum.