Submit your review | |
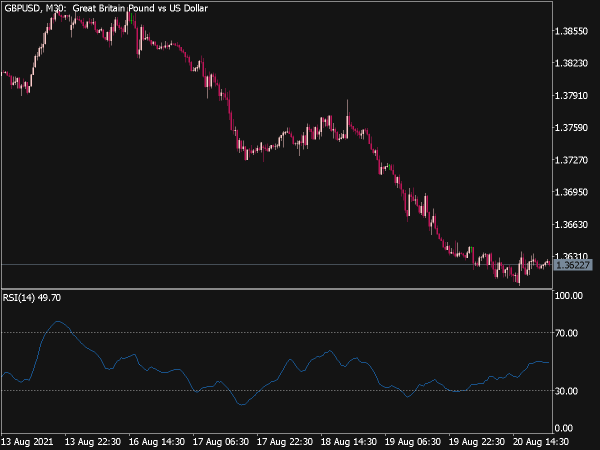
Relative Strength Index (RSI) is one of the most popular technical indicators amongst traders. RSI is a momentum oscillator developed by J. Welles Wilder. RSI computes momentum as the ratio of higher closes to lower closes, which means pairs which have had more or stronger positive changes have a higher RSI than pairs which have had more or stronger negative changes.
This indicator consists of one line which oscillates between zero and 100. This oscillator also has overbought and oversold zones, above 70 is considered as overbought and below 30 is considered as oversold zone. The formula for RSI is given below:
RSI = 100 – 100 / (1 + RS)
RS = average gain / average loss
Here "RS" is "relative strength", average gain is regarded as average of x days up closes and average loss is regarded average of x days down closes. Wilder recommended RSI to be used on a 14-day time frame, with high and low levels marked at 70 and 30, respectively. More extreme high and low levels of 80 and 20, or 90 and 10 occur less frequently but indicate stronger momentum.
Just like Stochastic, RSI also has overbought and oversold regions, whenever the RSI reaches above 70, the pair is considered to be overbought. And whenever the RSI reaches below 30 it is considered to be oversold.
RSI can be used to determine trend tops and bottoms, when RSI is in oversold zone we can expect a pair is making a trend bottom and thus we can prepare ourselves to go long. And when RSI is in overbought zone we can expect a pair is developing a trend top and thus we can prepare ourselves to go short.
RSI is a popular tool because it can also be used to confirm trend directions. If you think a trend is forming, take a quick look at the RSI and look at whether it is above or below 50. If you are looking at a possible uptrend, then make sure the RSI is above 50. If you are looking at a possible downtrend, then make sure the RSI is below 50.
📌 Great Indicators and Trading Systems for MT4 or MT5
- Top-Rated MetaTrader Indicators


- Color Zero Lag RSI Indicator

- Color RSI X20 Indicator

- Custom Moving Average Input Color

- V Grid Line Custom Indicator

- Pivot Fibs Custom Arr Indicator

- Time Candle Custom Indicator

- RSI Adaptive EMA Indicator

- Rocket RSI Indicator

- MACD of RSI adaptive EMA Indicator

- Multi Break Even Custom Script (MT5)
")
- Multi RSI Indicator

- Open Buy Stop Order Custom Script

- Standard Deviation Smoothing Indicator

- Fractal RSI Indicator

- Custom Moving Average Levels

- Custom Moving Average Inputs

- RSI Floating Levels Indicator

- RSI Histogram Round Indicator

- Risk Calculator Custom Script

- Two Dimension Array Fill and…

- Non-Repainting Non-Lagging Indicators