Submit your review | |
ℹ️ How to Read Price Trend with Technical Indicators
Reading price trend can be done in many ways. One of the ways is the use of technical indicators. These indicators have been developed by respectable and dedicated technical analysts. In this age, we don’t have to sweat anymore calculating their formulas and draw them on our charts. All we need now is optimize them to get better analysis result.
Not all technical indicators can be utilized to read price trend as each of them has its own purpose. Therefore, a technical analyst should use the correct tools to identify a trend persisting in a market. Following are some technical indicators for reading price trend and proper way to make use of them for that purpose:
Moving Average Convergence Divergence (MACD)
When we see MACD lines moves above the zero line, then price trend or direction tends to upward. And when MACD falls below the zero line, it indicates price direction tends to move downward. Moreover when both MACD line and Signal line are above or below the zero line, the possibility of further indicated direction will get higher.
Relative Strength Index (RSI)
Many technical analysts use RSI with this rule: when RSI reading is above 50, price trend is likely bullish and when RSI drops below 50, price direction is seemingly bearish.
Average Directional Index (ADX)
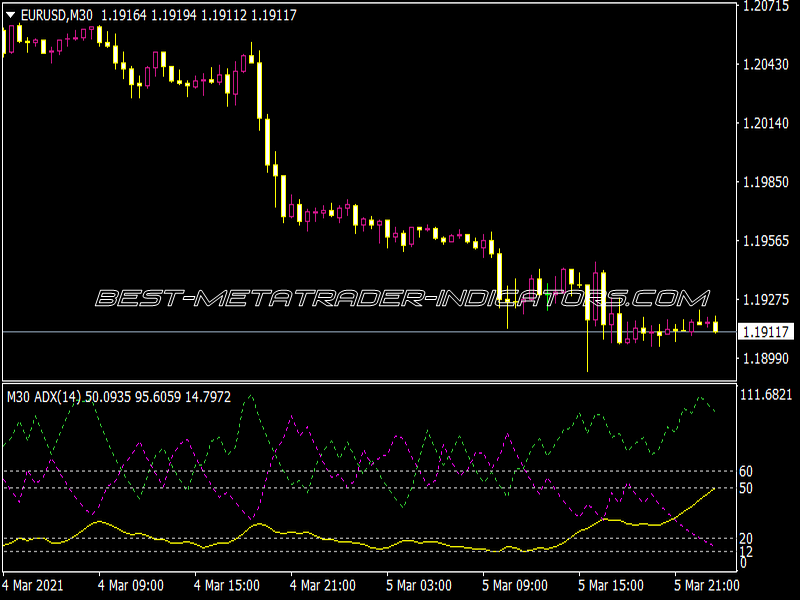
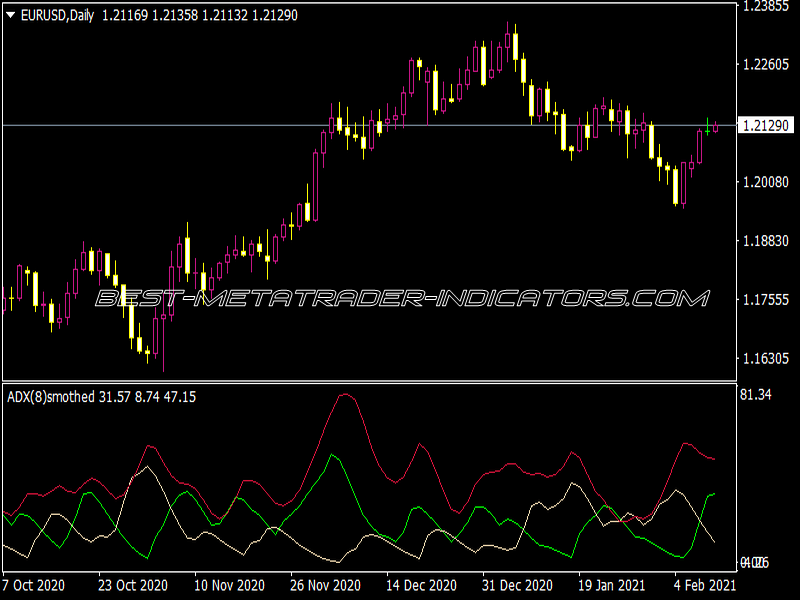
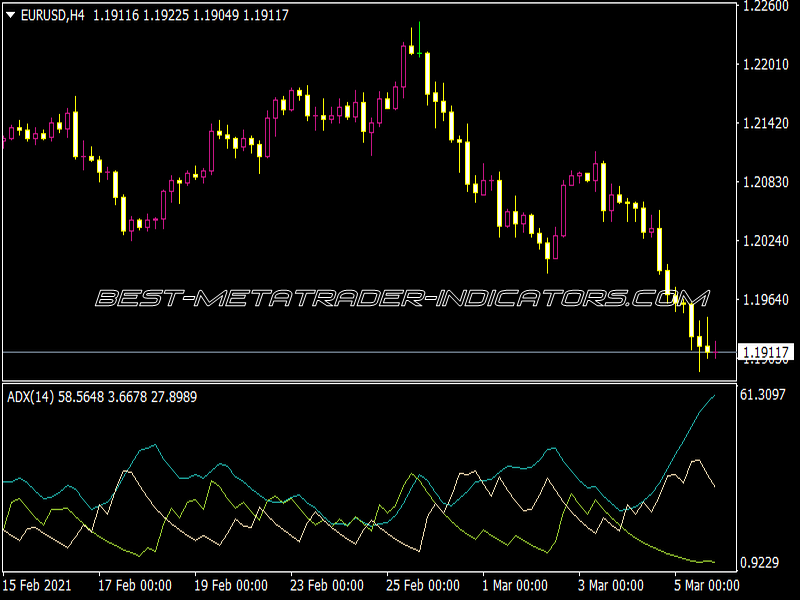
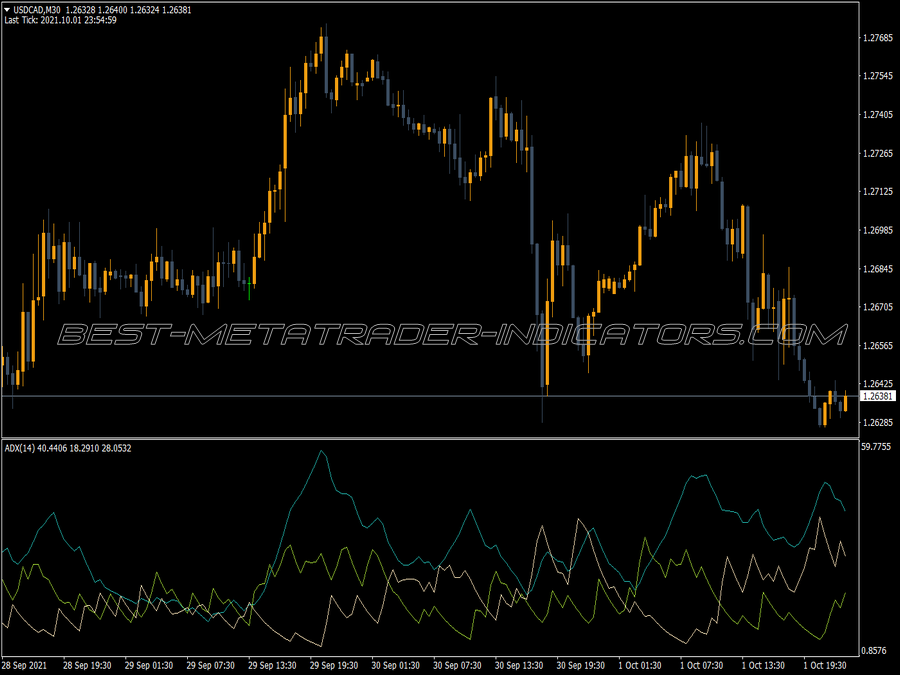
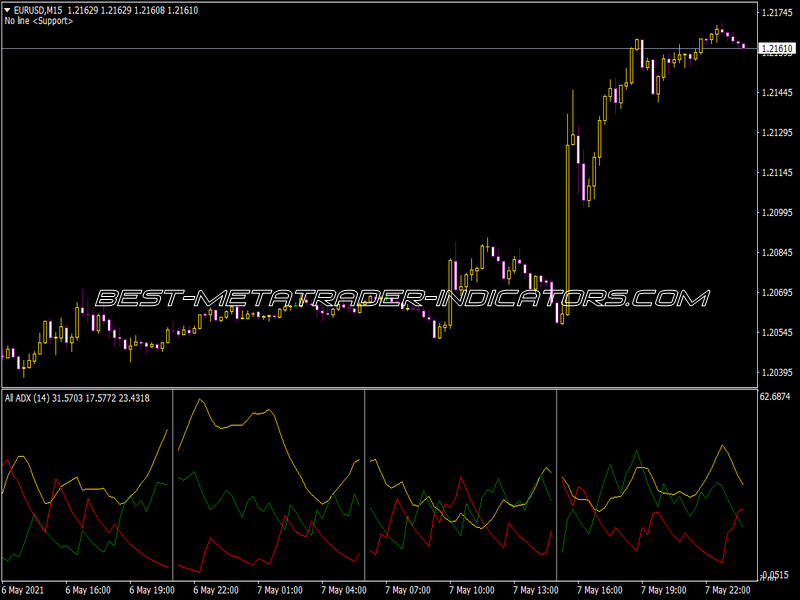
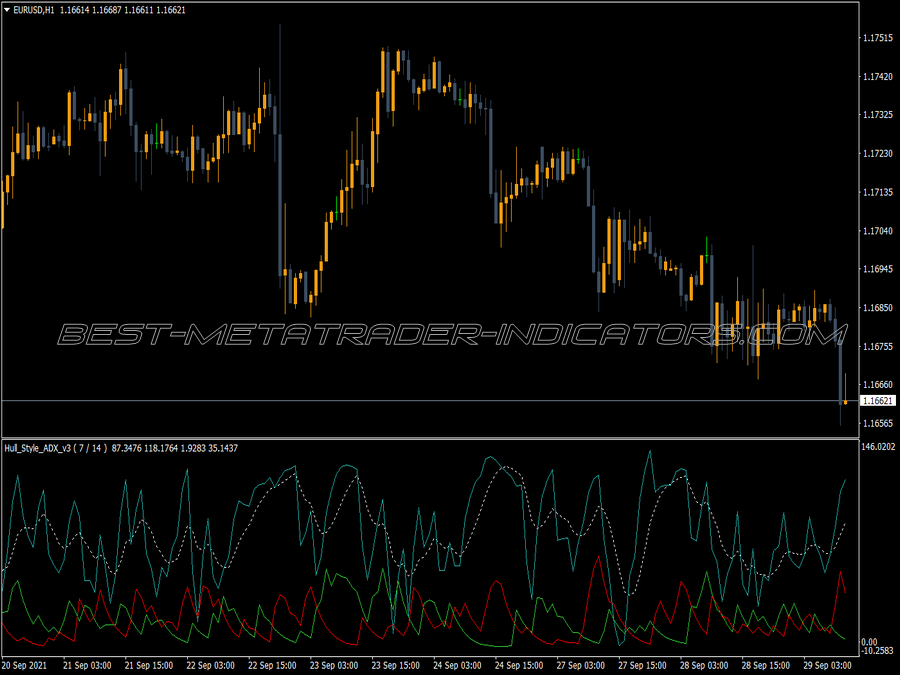
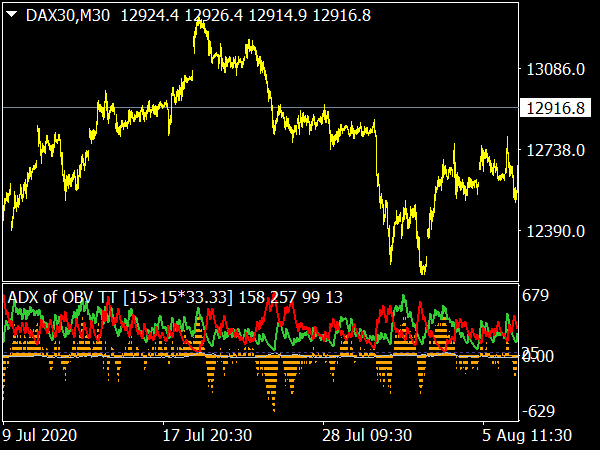
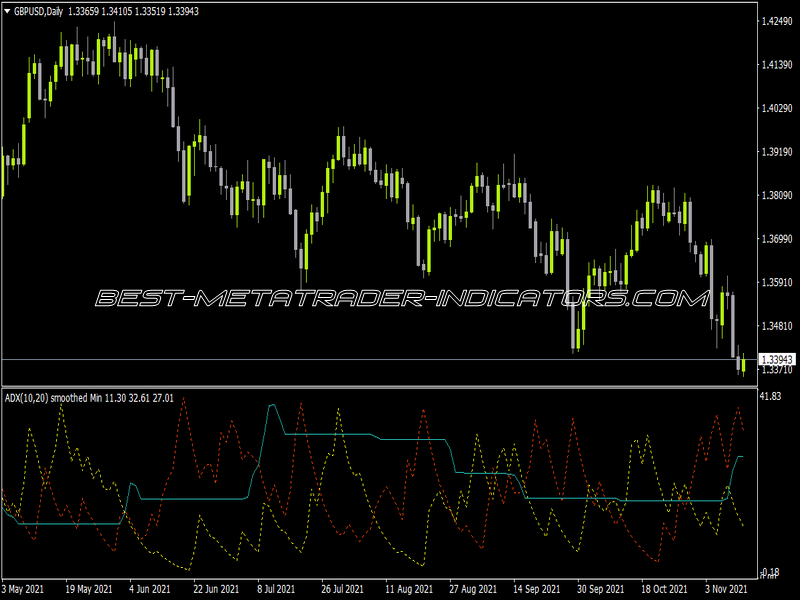
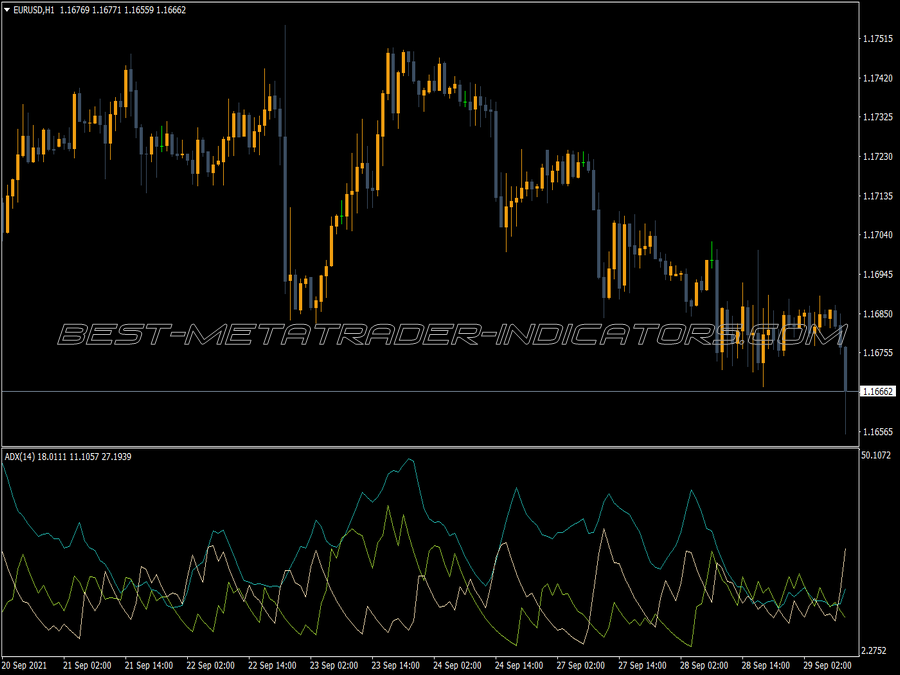
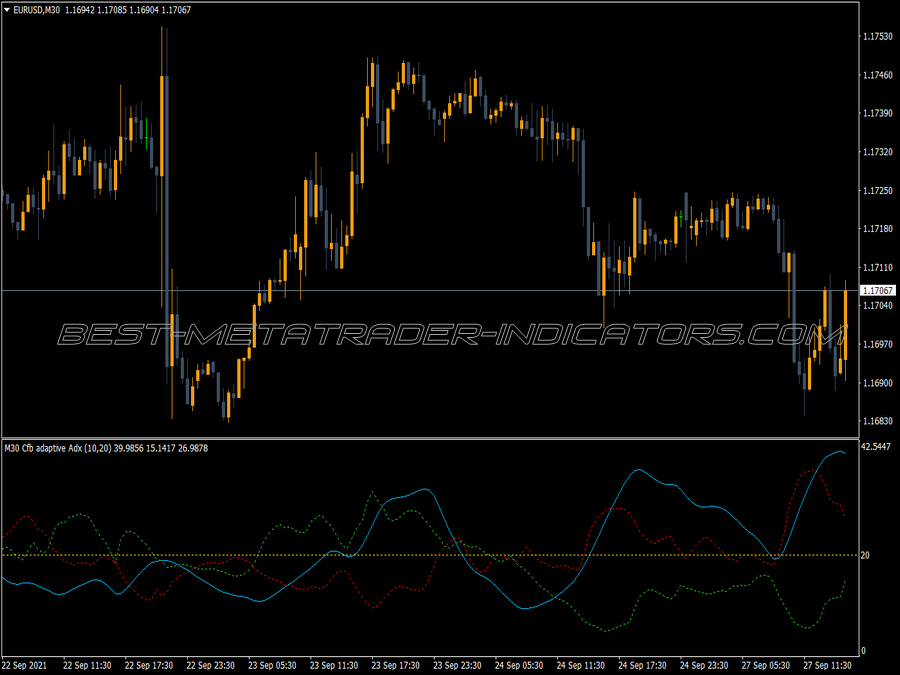
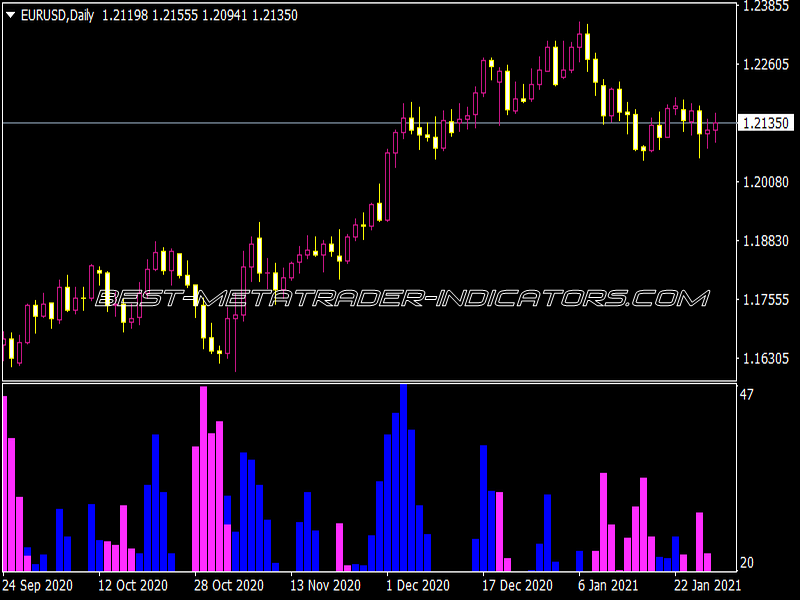
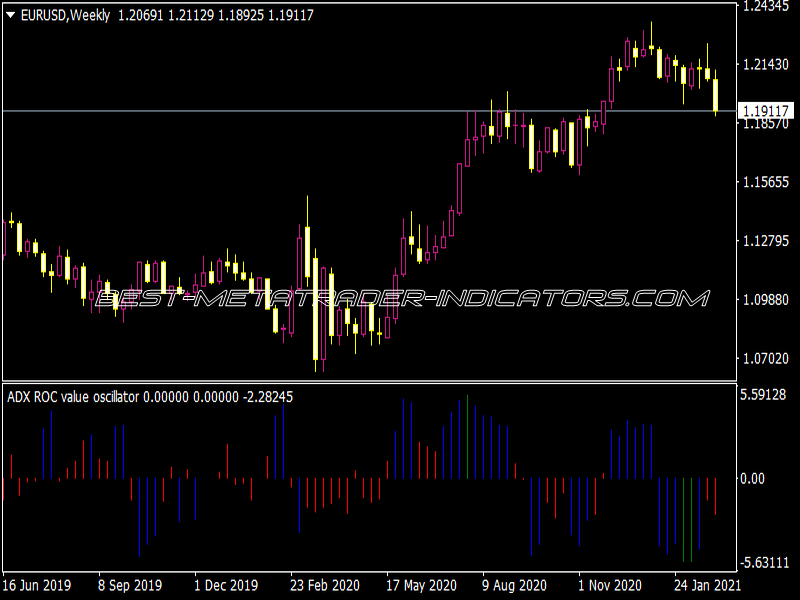
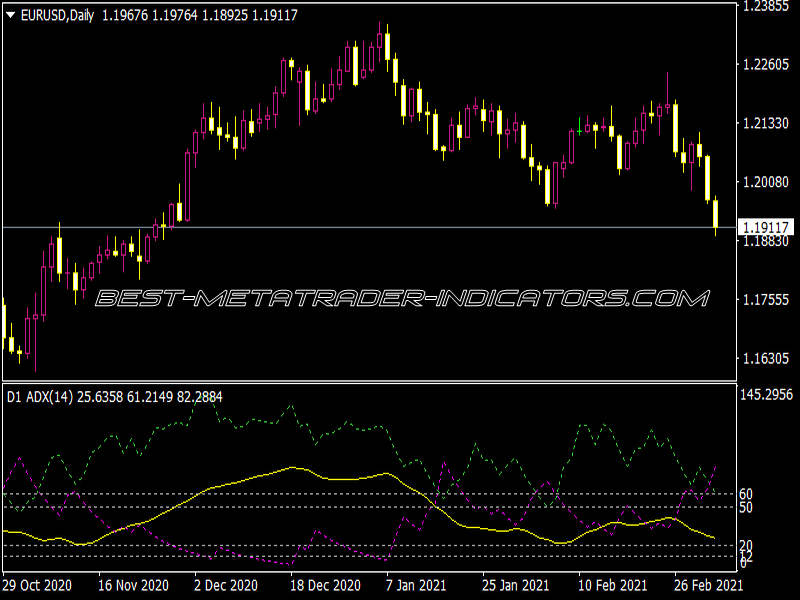
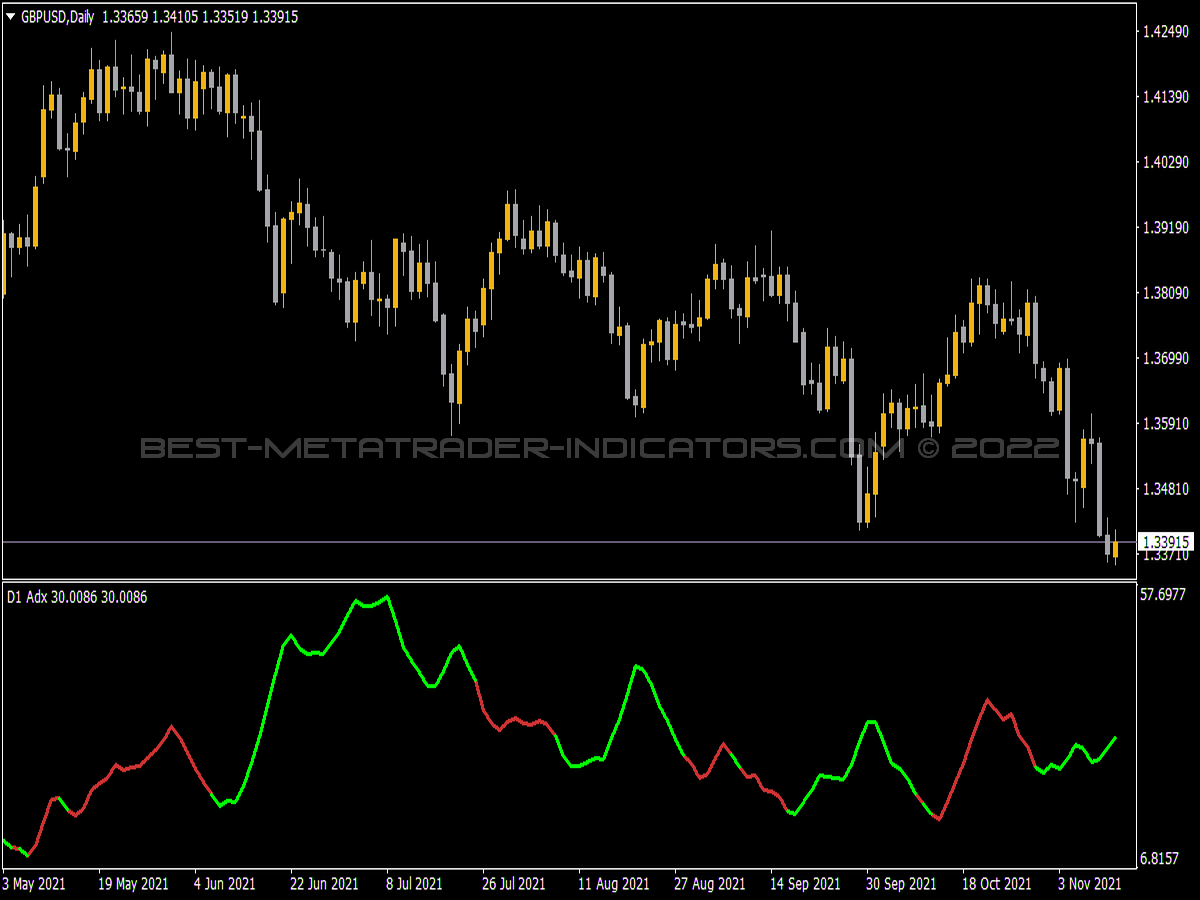
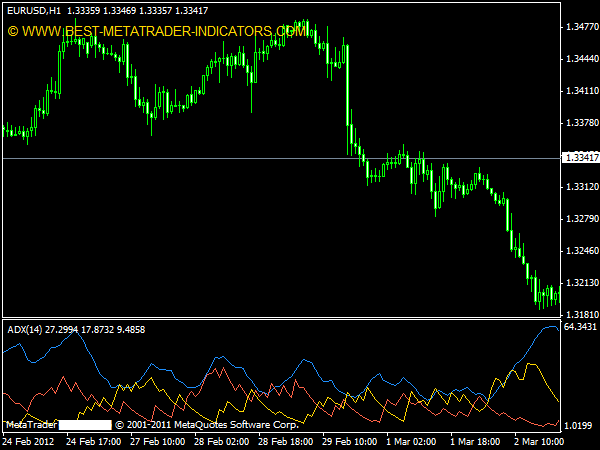
Actually the ADX itself doesn’t tell about to what possible direction price is inclined to go as the main purpose of ADX is to gauge trend’s strength. Still, when combined with the Directional Movement Index (DMI) lines, they will give clearer picture on possible upcoming trend.
When we see ADX rises above 25 and at the same time, the positive DMI is above the negative DMI, we will likely to have powerful uptrend. The rule is true for the opposite reading.
Parabolic Stop and Reverse (Parabolic SAR)
To use Parabolic SAR for trend reading purpose is similar like plotting a moving average on our chart. When price trades above Parabolic SAR, it will then likely to continue going higher. On the opposite, when price moves below Parabolic SAR, price is apt to fall until it meets certain support before reversing.
Of course, there are some other usages of those technical indicators. We will touch them on other trading tips. Just stay in touch with our site. See you around!
The 14-ADX should be over 35. Then an 8-point stochastic gives a buy signal when it turns up below 40. And a sell signal when it turns down above 60. With this simple system, false signals often occur, since stochastics are relatively slow. It is therefore advisable to use other oscillators, e.g. the double Stochastic or a modern oscillator.

