Submit your review | |
ℹ️ How to Spot Fibonacci Cluster Levels
Fibonacci Retracements are probability points where a currency or other market instruments will "bounce back" to, following a large move, and then continue in the original direction. Think of retracements in terms of Newton's Laws of Motion: “For every action there is an equal and opposite reaction."
And to add one more block above our previous discussion on how to properly draw Fibonacci retracement and to add more knowledge about this powerful technique in finding support and resistance, let's now focus on determining significant levels of Fibonacci retracement which known as Fibonacci retracement cluster levels.
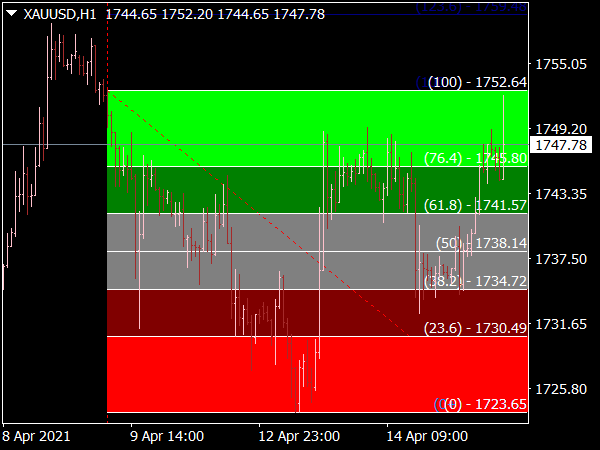
The Fibonacci cluster levels are a culmination of Fibonacci retracements from various significant highs and lows. Each overlapping price retracement levels will make a darker imprint on the cluster, enabling traders to see where the most significant Fibonacci support and resistance levels lie at.
This technique can be used in conjunction with other Fibonacci techniques or chart patterns to confirm support and resistance levels. These tools can be a major reaction low or high or a significant moving averages or trend lines. When you find such alignment of various tools, the reversal probability will increase. Definitely, it can provide a good trading opportunity too as you will find a good risk and reward ratio trade. Happy analyzing!
📥 More Top MT4 or MT5 Indicators with Instant Download
- Best-Rated MetaTrader Indicators

- Fibonacci Pivot Lines

- The Exit Strategy That…

- Auto Fibonacci Fan Indicator

- Time Zones Black Screen

- Iintraday Fibonacci Indicator

- Support Resistance Zones Indicator

- Gann Fibonacci Indicator

- Automatic Andrews Pitchfork Indicator

- Supply and Demand Zones…

- DEMA MACD Zones Amp Alerts

- DEMA MACD Zones Trading

- Auto Fibonacci Rising &…

- Bobo Fibonacci Indicator

- Triniti Best Zones Indicator

- Pulse Fibonacci Pivot Indicator

- Automatic Fibonacci Levels Indicator

- Breakout Zones System for…

- Breakout Zones Indicator

- KG Fibonacci MA Indicator

- Automatic Regression Channel

- Highly Accurate Indicators for MT4/MT5