Trend Following Indicator: Spot Momentum Before Major Moves

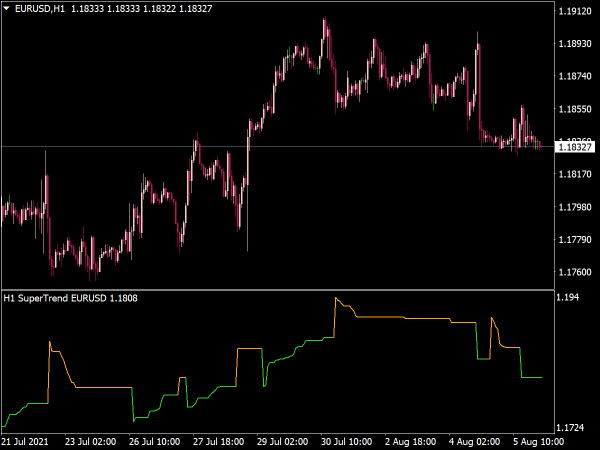
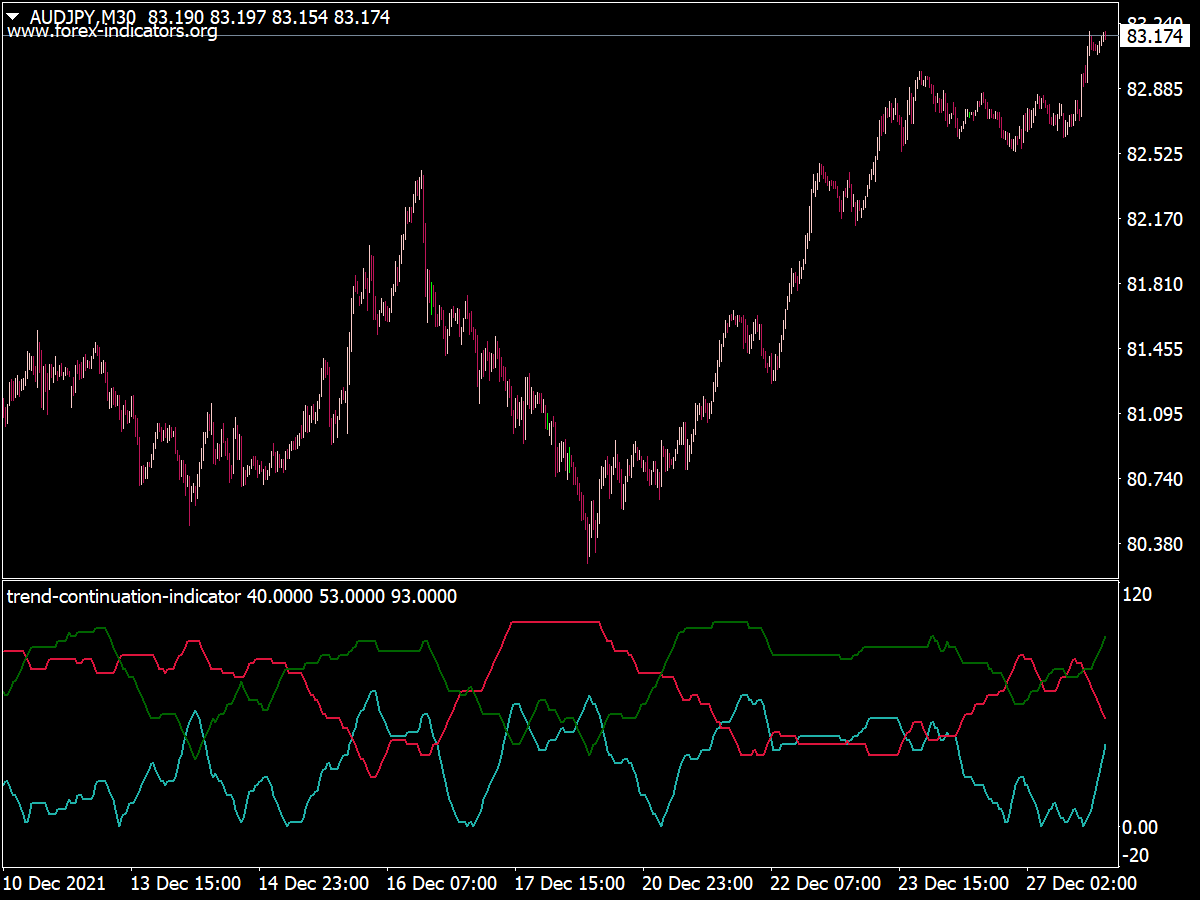
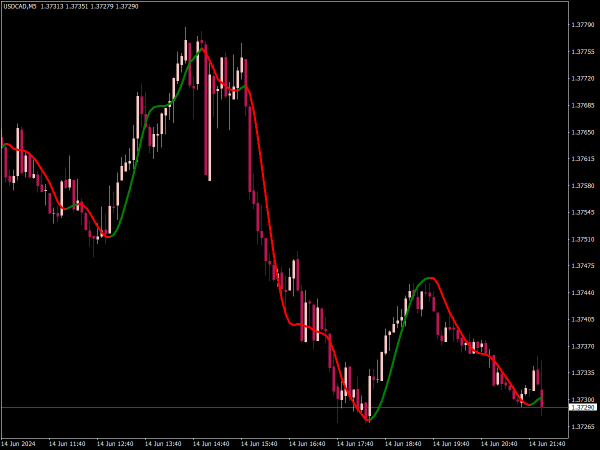
Trend Following Indicator with buy and sell trend signals on a Forex chart
Follow the dominant market direction with clearer trend confirmation and smarter trade timing.

A trend following indicator is not designed to predict the exact top or bottom of the market. Its real job is far more practical: it helps you stay aligned with the dominant direction, filter out random market noise, and build a repeatable trading process around momentum instead of emotion.

Many traders do not struggle because they cannot find trades. They struggle because they enter too early, exit without a plan, or keep fighting strong trends with emotional counter-trend ideas. A well-used trend following indicator can reduce that confusion by answering one simple question: is the market more likely trending up, trending down, or moving sideways?

📈 What Is a Trend Following Indicator?

A trend following indicator is a technical tool that helps traders identify the current direction of price movement. Instead of trying to forecast reversals, it follows existing price action and highlights whether buyers or sellers are currently controlling the chart.

In Forex trading, trend following indicators are often used to trade currency pairs that show clear momentum and clean market structure. They can also be useful for gold, indices, crypto, commodities, and stocks, but the logic stays the same: trade with the stronger side of the market, not against it.

Professional note: Trend following works best when the market actually trends. It becomes weaker during tight ranges, low-volatility pauses, or choppy consolidation zones. This is why context matters more than the indicator alone.

🧭 Why Trend Following Matters in Forex Trading

Forex markets often move in waves. A currency pair may trend for several candles, several sessions, or even longer when price keeps respecting the same directional structure. Trend following indicators help traders participate in those moves without needing to guess every turning point.

Direction

They help you understand whether price is generally moving higher, lower, or sideways.

Discipline

They reduce emotional entries by giving you a structured reason to enter, wait, or stay out.

Timing

They help filter pullbacks, breakouts, and continuation setups inside an existing trend.

📈 Smarter Entries. Cleaner Signals. Better Trades.

Professional Trading Indicators
professional-trading-indicators
PlayPause
Shadow

SEE PREMIUM TOOLS ⏩

⚙️ How a Trend Following Indicator Works

Most trend following indicators use price data to smooth out market noise. Some are based on moving averages, some measure momentum, and others combine volatility with directional signals. The goal is not to react to every small candle, but to create a clearer view of the broader market direction.

For example, when price stays above a rising moving average, many traders interpret that as an uptrend. When price stays below a falling moving average, they may see it as a downtrend. More advanced MetaTrader-compatible indicators may add trend strength, alerts, colored signals, scanners, or multi-timeframe confirmation.

Market ConditionIndicator BehaviorTypical Trader Action
UptrendPrice trades above a trend line, moving average, or bullish signal zone.Look for buy setups after pullbacks or breakout confirmations.
DowntrendPrice trades below a trend line, moving average, or bearish signal zone.Look for sell setups after retracements or breakdown confirmations.
Sideways MarketThe indicator becomes flat, mixed, or frequently changes direction.Reduce position size, avoid weak signals, or wait for a clean breakout.

🔥 Popular Types of Trend Following Indicators

There is no single perfect trend following indicator. Each tool has strengths and weaknesses. The best choice depends on your trading style, timeframe, risk tolerance, and whether you prefer early signals or stronger confirmation.

Below is a practical comparison of popular trend following tools used by Forex traders.

IndicatorBest ForStrengthWeakness
Moving AverageSMA, EMA, WMABasic trend direction and pullback trading.Simple, clean, and easy to understand.Can lag after sharp reversals.
MACDMomentum plus trendMomentum shifts and trend continuation.Shows both direction and momentum changes.Can produce false signals in ranges.
SupertrendVolatility-based trend toolClear visual buy and sell trend zones.Easy to read and useful for trailing stops.May flip too often in choppy markets.
ADXTrend strength indicatorMeasuring whether a trend has strength.Helps filter weak market conditions.Does not show direction by itself.
Ichimoku CloudFull trend structureMulti-layer trend analysis.Shows trend, support, resistance, and momentum.Can look complicated for beginners.

🎯 Simple Trend Following Strategy for Forex

Here is a beginner-friendly but professional approach that can be adapted to many currency pairs. The idea is to use a trend indicator for direction, a pullback for entry, and risk management for protection.

Strategy: Trend Pullback Continuation

  1. Choose a liquid Forex pair such as EUR/USD, GBP/USD, USD/JPY, or XAU/USD if you also trade gold.
  2. Open the higher timeframe first, for example H1 or H4, and identify the main trend direction.
  3. Use a trend following indicator such as EMA, Supertrend, or a professional trend scanner.
  4. Wait for price to pull back toward the trend zone instead of chasing an extended move.
  5. Look for confirmation: a bullish candle in an uptrend or a bearish candle in a downtrend.
  6. Place the stop loss beyond the recent swing high or swing low.
  7. Take partial profit at the next structure level and trail the rest if the trend continues.

🧪 Example: Using a Trend Following Indicator Step by Step

Imagine EUR/USD is trading above a rising 50-period EMA on the H1 chart. The trend is clearly bullish, but price has already moved far away from the average. Instead of buying late, a disciplined trader waits for a pullback.

When price returns near the EMA and forms a strong bullish rejection candle, the trader now has three useful pieces of confirmation: the trend is up, price has pulled back, and buyers have reacted from a logical area. This is usually a cleaner setup than entering randomly in the middle of a candle spike.

Risk warning: No trend following indicator guarantees profit. Every signal can fail. Always use a stop loss, control position size, and avoid risking money you cannot afford to lose.

🚨 Most Free Indicators Miss This Advantage

🧠 Best Timeframes for Trend Following Indicators

Trend following can work on different timeframes, but each timeframe has its own personality. Shorter charts create more signals, but also more noise. Higher charts create fewer signals, but often cleaner market structure.

TimeframeTrading StyleProsCons
M5 – M15ScalpingMore entries and faster feedback.More false signals and spread sensitivity.
M30 – H1Intraday tradingBalanced signals with manageable trade duration.Requires patience and clean session timing.
H4 – DailySwing tradingCleaner trends and less screen time.Wider stops and fewer setups.

✅ Trend Following Checklist Before You Enter a Trade

  • Is the higher timeframe trend clear?
  • Is price above or below the main trend indicator?
  • Is the indicator sloping in the same direction as the trade idea?
  • Is the market trending or only moving sideways?
  • Did price pull back to a logical area?
  • Is there candle confirmation or breakout confirmation?
  • Is the stop loss placed at a technical level?
  • Is the reward potential larger than the risk?
  • Are you trading during a liquid session?
  • Does the setup still make sense if price pulls back one more time?

🚀 Advanced Ideas for Better Trend Following

Experienced traders rarely use a trend indicator in isolation. They combine it with market structure, support and resistance, volatility, session timing, and risk management. This gives each signal more context.

Use Multi-Timeframe Confirmation

If the H4 trend is bullish, look for buy setups on H1 or M30. This keeps your entries aligned with the larger market flow.

Avoid Flat Indicator Signals

When a trend indicator becomes flat, price is often consolidating. This is where many false breakouts and fake signals appear.

Combine Trend and Volatility

A trend with expanding volatility often has more follow-through than a trend with weak candles and low range.

Trail Winners Carefully

Trend following is powerful because one strong winner can pay for several small losses. Do not cut every winning trade too early.

⚠️ Common Mistakes When Using Trend Following Indicators

Most problems come from unrealistic expectations. A trend following indicator is a decision-support tool, not a magic signal machine. The trader still needs judgment, discipline, and risk control.

Common mistakes to avoid:

  • Entering too late: Buying after a huge bullish move or selling after a huge bearish move often creates poor risk-to-reward.
  • Ignoring market structure: A buy signal directly below strong resistance may have limited potential.
  • Trading every signal: Not all signals are equal. Some appear in weak, messy, low-quality conditions.
  • Using too many indicators: Too many tools can create confusion and analysis paralysis.
  • No stop loss: Even the cleanest trend setup can fail quickly after a sharp liquidity spike or failed breakout.

📊 Trend Following Indicator vs Reversal Indicator

Trend following and reversal trading are very different approaches. Both can work, but they require different expectations. Trend following accepts that you may enter after the move has already started. Reversal trading tries to catch turning points, which can be profitable but often requires more precision and experience.

FeatureTrend Following IndicatorReversal Indicator
Main GoalTrade in the direction of existing momentum.Find potential turning points.
Entry StyleContinuation, pullback, breakout.Overbought, oversold, divergence, exhaustion.
Best MarketStrong directional markets.Range-bound or exhausted markets.
Main RiskLate entries and whipsaws.Fighting a strong trend too early.

💡 Pro Tips for Using Trend Indicators Better

  • Let the trend prove itself first. Do not force trades before structure becomes clear.
  • Use alerts instead of staring at charts all day. Alerts can help you wait for better conditions.
  • Respect support and resistance. A trend signal is stronger when it appears near a logical technical level.
  • Backtest your settings. The same indicator can behave very differently on EUR/USD, GBP/JPY, gold, or crypto.
  • Track your trades. A simple trading journal will show which pairs, sessions, and timeframes work best for your trend strategy.

🛠️ What Makes a Good Professional Trend Following Indicator?

A professional trend following indicator should do more than paint arrows on a chart. It should help you understand the quality of the trend, filter weak market phases, and support consistent trade planning.

Clear Trend Signals

The indicator should make direction easy to read without covering the chart with unnecessary visual noise.

Multi-Timeframe Logic

Professional traders often need confirmation from higher timeframes before entering on lower ones.

Smart Alerts

Push notifications, email alerts, and platform alerts can help traders react without staring at screens all day.

Scanner Functionality

A scanner can quickly identify which Forex pairs or markets are currently trending instead of manually checking every chart.

🎯 Precision Trading Starts With the Right Indicator

❓ Frequently Asked Questions About Trend Following Indicators

What is the best trend following indicator?

There is no universal best choice. Moving averages, Supertrend, MACD, ADX, and Ichimoku can all be useful. The best indicator is the one that fits your strategy and risk management.

Do trend following indicators repaint?

Some indicators may repaint depending on how they are coded. Always test an indicator in live market conditions or with historical replay before trusting its signals.

Can beginners use trend following indicators?

Yes. Trend following is often easier to understand than reversal trading because it focuses on trading with the current direction instead of guessing tops and bottoms.

Which timeframe is best for trend following?

H1, H4, and Daily charts are often cleaner for trend following. Scalpers can use M5 or M15, but they must handle more noise and faster decision-making.

Should I use only one indicator?

You can, but many traders combine one trend indicator with support and resistance, price action, volatility, and risk management for better context.

Why do trend indicators fail in sideways markets?

Because there is no strong directional movement to follow. In ranges, price crosses back and forth around the indicator, creating false signals.

🏁 Final Thoughts: Follow the Trend, But Manage the Risk

A trend following indicator can be a powerful tool for Forex traders who want a cleaner, more structured way to trade market direction. It helps filter noise, identify momentum, and avoid emotional counter-trend decisions.

However, the indicator is only one part of the trading process. The real edge comes from combining trend direction with smart entries, strong risk management, patience, and consistent execution. Follow the trend, respect the chart, and never forget that protecting your capital is more important than catching every move.

Disclaimer

Trading Forex, CFDs, crypto, gold, indices, and other leveraged markets involves risk. This article is for educational purposes only and does not provide financial advice, investment advice, or a guarantee of trading results. Always test any strategy first, use proper risk management, and trade only with capital you can afford to lose.

Best Gold Trading Strategies for XAU/USD Traders

Best Gold Trading Strategies with trend breakout chart and risk management concepts
Best Gold Trading Strategies for XAU/USD traders using trend following, breakout setups, and smart risk management.

Gold is not just another forex pair. XAU/USD can move aggressively, reject levels with precision, expand fast from liquidity zones, and punish traders who enter without a structured plan. The best gold trading strategies combine market structure, price action, liquidity, volatility, risk control, and clean execution.

This guide explains practical gold trading strategies, entry ideas, confirmation tools, checklists, comparisons, common mistakes, and FAQs for traders who want a professional technical framework instead of random signals.

🏆 Why Gold Is Popular Among Forex Traders

Gold is one of the most actively traded instruments among technical traders. In the forex market, traders usually trade it as XAU/USD, which means the price of gold quoted against the U.S. dollar. Gold attracts attention because it often creates clean intraday ranges, strong breakouts, sharp pullbacks, and clear reactions around important support and resistance zones.

Volatility

Gold can create strong intraday moves, making it attractive for day traders and scalpers who wait for clean setups.

Liquidity

XAU/USD usually offers deep liquidity, especially during the London and New York sessions.

Technical Precision

Gold often reacts clearly around previous highs, previous lows, trendlines, moving averages, and supply or demand zones.

Trader’s note: Gold can be very technical, but it is also very fast. A clean chart setup still needs confirmation because a single impulsive candle can easily trap early entries.

📌 What Moves Gold Price Technically?

Before choosing a gold trading strategy, understand the technical forces behind XAU/USD movement. Gold often moves because price is reacting to liquidity, imbalance, trend pressure, failed breakouts, or a shift in market structure.

Technical DriverTypical Impact on GoldTrading Note
Liquidity ZonesPrice often sweeps previous highs or lows before reversing or continuing.Watch obvious swing points and session extremes.
Market StructureHigher highs and higher lows support longs; lower highs and lower lows support shorts.Important for trend and swing traders.
Volatility ExpansionAfter compression, gold can break strongly once momentum enters the market.Be careful around tight ranges and breakout candles.
Support and ResistanceClean zones can create strong reactions, retests, and continuation setups.The best zones are obvious on higher timeframes.
Moving Average PressureDynamic support or resistance can guide trend pullbacks.More relevant when price is trending cleanly.

🚀 Premium Trading Solutions for Traders Who Demand More

Day Trading Indicator for MT4
day-trading-indicator-mt4
PlayPause
Shadow

GET PREMIUM INDICATORS ⏩

📈 Strategy 1: Trend Following Gold Strategy

The trend-following strategy is one of the most reliable gold trading approaches when XAU/USD is moving strongly in one direction. Gold often creates powerful trends after clean breakouts, structure shifts, or strong momentum from a major technical zone.

How to Trade It

  1. Identify the trend on the 4H or daily chart.
  2. Use moving averages such as the 20 EMA, 50 EMA, or 200 EMA to define direction.
  3. Wait for a pullback into a dynamic support or resistance area.
  4. Look for bullish or bearish rejection candles.
  5. Enter only after confirmation, not during emotional spikes.

Best use: This strategy works well when gold is making higher highs and higher lows in an uptrend, or lower highs and lower lows in a downtrend.

💧 Strategy 2: Liquidity Sweep and Reversal Strategy

Gold frequently hunts liquidity above highs and below lows before reversing. Many retail traders place stop losses at obvious levels, and larger orders often appear around these zones, creating sharp reactions and fast directional shifts.

Bullish Liquidity Sweep

Price breaks below a previous low, triggers stops, quickly rejects the level, and closes back above support. This can signal a potential long setup.

Bearish Liquidity Sweep

Price breaks above a previous high, grabs liquidity, fails to hold above resistance, and closes back below the level. This can signal a short setup.

Confirmation idea: Do not enter only because price sweeps a high or low. Wait for displacement, a market structure shift, or a strong rejection candle.

🔥 Strategy 3: Breakout and Retest Strategy

The breakout and retest strategy is popular because it gives traders a logical entry after price confirms a new direction. Instead of chasing the breakout candle, patient traders wait for price to return to the broken level.

Breakout Retest Rules

  • Mark a clear support or resistance zone.
  • Wait for a strong candle close beyond the zone.
  • Avoid weak breakouts with long wicks and no follow-through.
  • Wait for price to retest the broken level.
  • Enter after rejection or continuation confirmation.
  • Place the stop loss beyond the retest zone.

Warning: Gold often creates false breakouts. A breakout without momentum, displacement, or a strong candle close is not enough.

⚡ Strategy 4: London and New York Session Strategy

Gold often becomes more active during the London and New York sessions. The overlap between these sessions can bring strong movement because liquidity increases and short-term traders react quickly to breakouts, sweeps, and retests.

SessionGold BehaviorBest Strategy Type
Asian SessionOften slower, but can create ranges and liquidity levels.Range marking and preparation.
London OpenCan create the first major directional move.Breakout, fakeout, liquidity sweep.
New York OpenHigh volatility, especially when price reaches important intraday levels.Momentum, reversal, volatility-control strategy.
London-New York OverlapOften the strongest liquidity window.Trend continuation and intraday setups.

🧠 Strategy 5: Support and Resistance Strategy

Support and resistance levels are still among the most useful tools for gold traders. The key is to avoid drawing too many levels. Gold responds best to clean, obvious zones that are visible on higher timeframes.

Strong Support Zone

A level where price previously rejected lower prices multiple times, ideally with strong bullish reaction candles.

Strong Resistance Zone

A level where price repeatedly failed to continue higher, especially if the zone aligns with previous highs or supply areas.

For higher-quality setups, combine support and resistance with trend direction, liquidity, candle confirmation, and session timing.

📊 Strategy 6: Moving Average Pullback Strategy

Moving averages help traders filter market direction and avoid trading against the dominant trend. In strong gold trends, price often pulls back into the 20 EMA or 50 EMA before continuing.

Example Setup

  1. Price is above the 50 EMA and 200 EMA.
  2. The 50 EMA is above the 200 EMA.
  3. Price pulls back toward the 20 EMA or 50 EMA.
  4. A bullish rejection candle appears.
  5. Entry is taken after confirmation with stop loss below the pullback low.

📰 Strategy 7: Volatility-Aware Gold Trading

Gold can move violently when volatility expands around key levels. Some traders try to catch the first spike, but this is risky because spreads can widen, slippage can increase, and price can move in both directions within seconds.

High-volatility moments to watch: session opens, liquidity sweeps, range breakouts, failed retests, sharp trendline breaks, and fast moves away from previous daily highs or lows.

Safer Volatility Trading Approach

  • Avoid entering right before price reaches an obvious liquidity pool.
  • Wait for the first spike to finish.
  • Let price choose direction.
  • Trade the retest or continuation after volatility settles.
  • Reduce position size because gold spreads and slippage can increase during fast moves.

🔥 Pro-Level Indicators Built to Elevate Your Trading Game

🧩 Best Indicators for Gold Trading

Indicators should support your trading decision, not replace it. The best gold traders usually combine clean price action with a small number of confirmation tools.

Indicator comparison for XAU/USD trading strategies

IndicatorBest UseStrengthWeaknessRating
Moving Averages20 EMA, 50 EMA, 200 EMATrend direction and pullbacksSimple and effective in trending marketsCan lag in choppy conditions★★★★★
RSIMomentum oscillatorOverbought/oversold and divergenceUseful for reversal confirmationCan stay extreme during strong trends★★★★☆
ATRVolatility measurementStop loss and target planningAdapts risk to market volatilityDoes not show direction★★★★☆
Volume ProfileMarket participation zonesValue areas and liquidity zonesGreat for advanced level analysisCan be confusing for beginners★★★★☆
MACDTrend and momentumTrend confirmationGood for momentum shiftsLate signals in fast markets★★★☆☆

✅ Gold Trading Checklist Before Entry

Professional traders do not enter because gold “looks bullish” or “looks bearish.” They use a checklist to avoid emotional decisions.

Pre-Trade Checklist

  • Is the higher-timeframe trend clear?
  • Is price near a key support, resistance, liquidity, or demand/supply zone?
  • Is there a clean entry trigger?
  • Is the stop loss placed at a logical invalidation point?
  • Is the risk-to-reward ratio at least acceptable?
  • Is price entering a high-volatility zone?
  • Is position size calculated correctly?
  • Is the trade aligned with your written plan?

🛡️ Risk Management for Gold Trading

Risk management is more important in gold trading than finding the perfect entry. Gold can move fast, and oversized positions can destroy accounts quickly.

Risk Small

Many professional traders risk only a small percentage per trade, especially on volatile assets like gold.

Use Logical Stops

Do not place stops randomly. Put them where your trade idea is clearly invalidated.

Avoid Revenge Trading

Gold can tempt traders to recover losses quickly. This often leads to bigger mistakes.

Important: Never increase lot size just because gold “must reverse.” The market does not care about opinions. Only your risk plan protects your account.

⚖️ Scalping vs Day Trading vs Swing Trading Gold

StyleTimeframeBest ForMain Risk
Scalping1M to 5MFast traders who can manage execution and spreadsOvertrading and noise
Day Trading5M to 1HTraders who want intraday opportunities without overnight exposureVolatility spikes and emotional entries
Swing Trading4H to DailyPatient traders who follow higher-timeframe structure and technical directionWide stops and changing market structure

🚫 Common Gold Trading Mistakes

Chasing Big Candles

Entering after a large candle often means poor risk-to-reward and emotional decision-making.

Ignoring Volatility

Gold can reverse violently after sweeps, breakouts, and failed retests. Always know where liquidity is sitting.

Too Many Indicators

Overloaded charts create confusion. Use only tools that support your trading plan.

No Exit Plan

A good entry is not enough. You need a stop loss, target, and management plan before entering.

💡 Practical Gold Trading Tips

  • Trade gold only when spreads are reasonable and liquidity is strong.
  • Use higher timeframes to define bias before entering on lower timeframes.
  • Do not trade every move; wait for your best setup.
  • Mark previous daily highs and lows because gold often reacts around them.
  • Be careful during the first minutes after a sharp volatility expansion.
  • Use partial profits if gold moves quickly in your favor.
  • Journal every gold trade and review screenshots weekly.
  • Avoid trading when you are tired, angry, or trying to recover losses.

🧭 Example Gold Trading Plan

Simple XAU/USD Day Trading Plan

Market: XAU/USD

Sessions: London open, New York open, London-New York overlap

Timeframes: 1H for structure, 15M for setup, 5M for entry

Setups: Breakout retest, liquidity sweep, trend pullback

Risk: Fixed percentage per trade

Rules: No entries during impulsive spikes, no revenge trades, maximum daily loss limit

📝 Final Gold Trading Strategy Checklist

  • Define the trend first.
  • Mark key liquidity and support/resistance zones.
  • Wait for price to come to your level.
  • Use confirmation before entering.
  • Calculate risk before placing the trade.
  • Avoid volatility traps and emotional entries.
  • Manage the trade according to your plan.
  • Review the result after the trade closes.

⚡ Professional Indicators That Give You the Trading Edge

❓ FAQs About Gold Trading Strategies

What is the best strategy for trading gold?

The best strategy depends on your trading style, but trend following, breakout retests, liquidity sweeps, and support/resistance strategies are among the most practical approaches for XAU/USD.

Is gold better for scalping or swing trading?

Gold can work for both. Scalpers benefit from volatility, while swing traders benefit from larger higher-timeframe moves. The key is matching strategy to personality and risk tolerance.

Which session is best for trading gold?

The London session, New York session, and their overlap often provide the best liquidity and volatility for active gold traders.

Which indicators work best for gold?

Moving averages, RSI, ATR, MACD, and volume-based tools can help, but they should be used with price action and market structure.

Why does gold move so fast?

Gold often moves quickly because liquidity is concentrated around obvious highs, lows, breakouts, and retests. When those levels fail or hold, price can reprice sharply.

Can beginners trade gold?

Beginners can trade gold, but they should start with small risk, avoid impulsive volatility trading, use a demo account first, and focus on one simple strategy.

✅ Conclusion: The Best Gold Strategy Is the One You Can Execute Consistently

The best gold trading strategies are not magic formulas. They are structured ways to read price, manage risk, and avoid emotional decisions. Gold rewards patience, discipline, and preparation. Whether you trade trend pullbacks, liquidity sweeps, breakout retests, or session-based setups, your edge comes from consistency.

Focus on one strategy first, master the conditions where it works best, and protect your capital at all times. In gold trading, survival and discipline are more important than predicting every move.

Disclaimer

This article is for educational purposes only and does not provide financial advice. Trading gold and forex involves risk, and every trader is responsible for their own decisions, risk management, and results.

Enjoy the Future of Trading with the Best Pro Indicators

Forex Indicators for MT4 and MT5
forex-indicators-for-mt4-and-mt5
PlayPause
Shadow

Highly Accurate Indicators for Quick & Consistent Gains