Submit your review | |
A big mistake that many traders make for overbought and oversold is working with the set extreme zones of 80 and 20. This is a fundamental mistake, because the original inventors of oscillators like George Lane of Stochastics, assumed that these extreme zones are only used if there is a trend on the one hand and on the other hand only in the direction of this overarching trend and if there are additional divergences. One should therefore use the means of zone analysis for indicators, especially for oscillators.
Another error is the use of arbitrary, because common time lengths for oscillators and indicators. You should always take the length that is appropriate to the respective cycle. The reason is that for example an oscillator of ten days or ten bars can only capture movements that occur within these ten bars, not movements that are shorter or longer. For this reason, you should work with several oscillators if possible.
Larry Williams recommends to work with two oscillators that are tuned to two important cycles and then to calculate a momentum from their values using the difference method. For most oscillators, a strong swing to the extreme means that this area is tested or breached again. Only the divergences point to a change of course.
If the oscillator is in the overbought area and in the upper extreme range, it is a sign of the strength of the market if there is no or only a slight price correction. Conversely, it is a sign of market weakness when the oscillator is in the lower extreme range and the market hardly rises. Insofar, oscillators are also trend indicators.
A stochastic loser club is the large mass of traders who lose money on the stock market because they schematically cling to certain popular indicators, especially oscillators such as Stochastic, RSI or trend followers, such as the MACD. However, this does not speak against these indicators, but rather against the traders.
Especially with oscillators, such as Stochastic, it is important always to work with different time frames. On a daily basis and even more strongly in the day trading area, Stochastic gives a lot of false signals. However, if you filter the signals on a weekly basis, the hit rate increases dramatically. But also the many false signals can be interpreted. If the market is overbought without prices correcting significantly, then this is a sign of market strength and thus bullish. If the prices are oversold without the market rising significantly, then this testifies to market weakness and is bearish.
In addition, oscillators must always be used in general in conjunction with other indicators, for example the ADX as a trend indicator, and of course one must also use the modern indicators that apply the full capabilities of the computer. A rising ADX, especially if it is still quite high, requires only those oscillator signals to be considered that are going in the trend direction. If the ADX drops, especially if it is quite low, you can also trade against the trend with oscillators.
The terms overbought and oversold used to be applied only to extreme market conditions that occur every few years. Therefore, this concept is questionable in shorter periods of time. Apart from that, the extreme levels shift depending on the stock market phase and market sentiment. Therefore, it makes sense not to specify certain levels of the oscillator, which should then be overbought or oversold, but relative to certain levels of volatility.
A good tool for this are the Bollinger bands. You can simply proceed by considering the respective level of the oscillator as overbought or oversold, which reaches when the prices have reached the upper or lower line of the Bollinger bands, but you can also apply the Bollinger bands directly to the indicator, if the software allows it.
A little-used option is to apply zone analysis to oscillators and, in some cases, to trend following indicators. Similarly, Fibonacci and Murrey can be useful for the indicators. You should never use the oscillators alone, but always use a different type of indicator as a filter. Trend indicators, trend followers, such as the MACD, and modern indicators are particularly suitable.
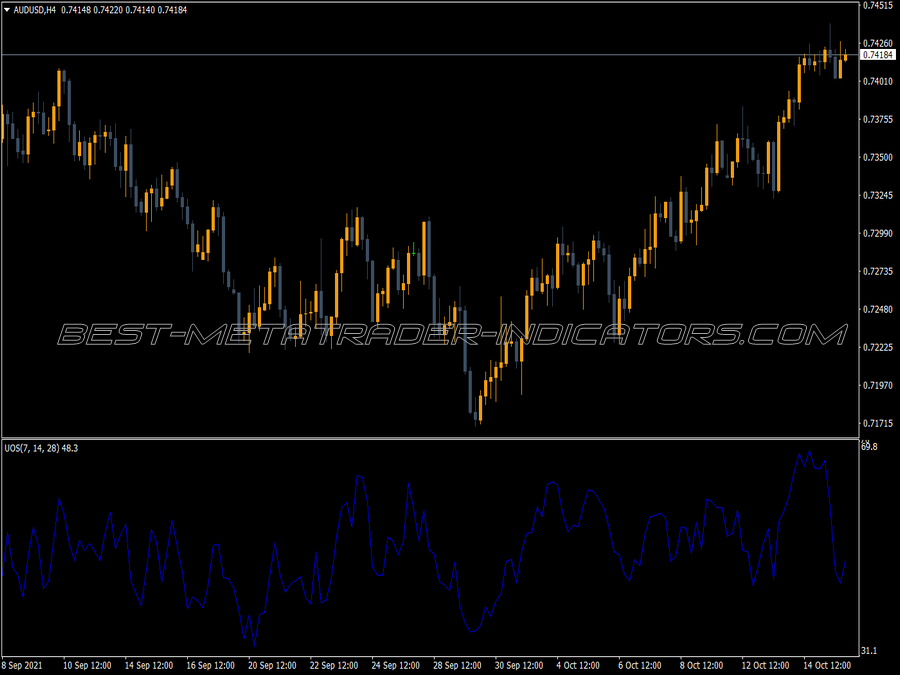
In general, those oscillators that say something about the Momentum are particularly useful. These are, of course, the Momentum itself and the ROC, but also the Stochastic, the CCI and the RSI and others.
Oscillators are also useful for trend determination. Many, such as the RSI, hardly ever reach the other extreme zone in a trend. If, on the other hand, they oscillate back and forth, the market is trendless or in a sliding zone. Of course, it also follows that the oscillators may only be used in the trend direction. So you only use them as a timing instrument and go with the current trend, so not to determine the market direction.
The oscillators give signals later than the price movements, because they have to wait for them and are calculated by them. It is therefore advisable to always combine oscillators with methods that enable forecasts, that are forward-looking. Examples include Fibonacci, Gann, Murrey, Astrology and, to a certain extent, cycle research. Stochastic is particularly suitable for combination with such methods. Even better, some modern indicators are suitable.
The popularity of oscillators is explained by the fact that they subsequently identify every summit and every floor. However, this is not so relevant for trading, as they remain in the extreme range for too long. Therefore, in any case, it is only necessary to take them as an additional procedure in connection with other indicators, for example the modern indicators, the Candlestick charts or resistance and support zones, as well as Gann Angles, the Fibonacci levels, the Murrey or Planetary lines.
🎁 Download More Great Indicators for MT4 or MT5
- Top-Rated MetaTrader Indicators

- USD Strength Oscillator

- 5-34-5 Oscillator

- Wave Trend Oscillator Averages

- Nihilist Ultimate Adx Indicator

- Ultimate MA

- Ultimate Arrow Binary Options System

- SlowKD Oscillator

- RSI Currency Strength Oscillator

- Variation Oscillator

- Rahul Mohindar Oscillator (RMO)
")
- Vinini WPR Oscillator

- Chifbaw Oscillator

- VWAP Oscillator

- RSI Bollinger Oscillator

- Ultimate Snake Method Trading System

- Ultimate Pro Scalper Indicator for MT4

- Ehlers Histogram Oscillator

- Forex Pairs Oscillator

- Ahoora Oscillator

- Ultimate Machine Trading System

- Highly Accurate Indicators for MT4 & MT5