Submit your review | |
ℹ️ How to Identify a Trend and Trend Reversal Using RSI
To continue our previous trading tip on how to suitably fan out Relative Strength Index, we now touch about other uses of RSI. As we all know that RSI can be used for determining overbought and oversold condition, bullish and bearish divergence as well as for generating buy and sell signals. There are at least three other uses of RSI as our reliable technical indicator while examining a market. Be sure that we will have a good understanding about all of RSI uses. It will indeed pay off!
RSI can read a trend
Reading a trend is the most important stage when analyzing a market. Many ways can be done to identify a trend. Fortunately, we can also use RSI to read a trend. Following rules can be our guide when using RSI to read a trend:
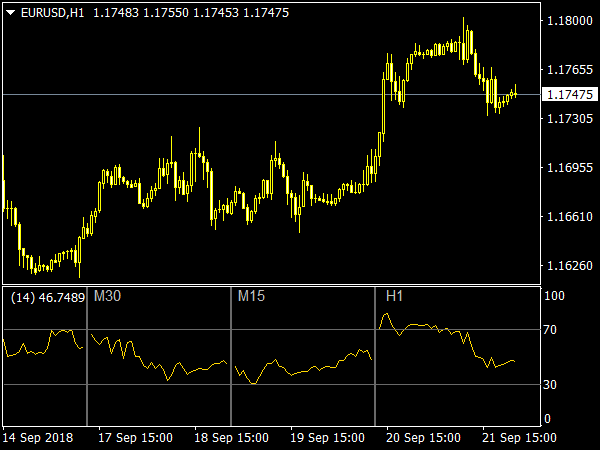
• RSI usually travels between 40 and 90 during an uptrend (bull market). Supports for RSI commonly located at 40-50 zones.
• RSI commonly fluctuates back and forth within 10 and 60 zones during a downtrend (bear market) and 50-60 zones will be acting as resistance levels.
• Of course, those ranges may differ when we use different RSI parameters. Trend strength and market volatility surely affects the ranges.
With failure swings, RSI can identify an impending reversal
A good indication presented by RSI is failure swings. With failure swings, we can predict an impending reversal and also a possibility for a new trend continuation. A failure swing occurs when RSI moves up from 30 then at certain level a pullback happens but RSI keeps staying above 30 then it moves up again and breaks the previous peak of RSI. Such picture exhibits a failure swing-buy signal.
A failure swing-sell signal is the mirror of failure swing-buy signal. It takes place when RSI falls from 70 and retraced back upside below 70 before stalling again below the previous trough.
RSI can be used as Positive-Negative Reversals identifier
Andrew Cardwell, an analyst, developed the so-called Positive-Negative Reversals approach for RSI. This approach is different with common bullish and bearish divergence. Cardwell said that a bearish divergence is a signal of impending uptrend and a bullish divergence takes place before an upcoming downtrend. Getting confused? Don't be.
A Positive Reversal, which signals an impending uptrend, is formed when RSI creates a series of lower lows while price shapes a series of higher lows in certain period of time. And a Negative Reversal appears when RSI presents a series of higher highs when price exhibits lower highs. Both Positive Reversal and Negative Reversal rarely appear especially in forex market.
Ok, so far we know what the RSI is and how to fan it out properly. The most important thing after this is keep on practicing using the RSI so we can get the best of it. And it's also a valuable thing to stay in touch with Best-MetaTrader-Indicators.com. See you around, traders!
📌 Great Indicators and Trading Systems for MT4 or MT5
- Top-Rated MetaTrader Indicators


- All Averages V4.9 Indicator

- Murrey Math All Time Frames Indicator

- All in One Indicator

- All Heikin Ashi V2.4 Indicator

- Murrey Math All Time Frames…

- Fxi All Pivots Indicator

- All Averages V3.1 Indicator

- All Time Frame Macd Window Indicator

- All Time Frame Macd Bars Indicator

- DSL All RSI MTF Indicator

- RSI Indicator- All Timeframes

- All Market Symbols and Data…

- Braintrend 2 All In One

- All CCI MTF Indicator

- All Pivot Points Indicator

- All Averages V2.5 Distance Indicator

- All Heikin's Ashi Histo V2.3…

- Zmfx All Pivot Levels V2 Indicator

- All TF Indicator

- All In One Grab Indicator

- Non-Repainting Non-Lagging Indicators