The ICT Indicator is built for traders who want to move beyond random signals and read the market through smart money concepts: liquidity, displacement, fair value gaps, order blocks, market structure shifts and premium-discount pricing. It is not a shortcut or a magic buy-and-sell button. Used correctly, it becomes a structured decision tool that helps you understand where price may hunt liquidity, where large players may reprice the market, and where cleaner trade setups can form.
From real chart work, the biggest advantage of an ICT-style indicator is not that it predicts the future. The advantage is that it forces you to slow down, mark key zones, wait for confirmation, and trade from areas where risk can be defined clearly before the order is placed.
🧠 What Is an ICT Indicator?
An ICT Indicator is a MetaTrader-compatible trading tool that visualizes concepts inspired by the Inner Circle Trader methodology. These concepts usually focus on how price moves between liquidity pools, how market structure changes after stop hunts, and how fair value gaps or high-volume impulse candles can become reaction zones on a live chart.
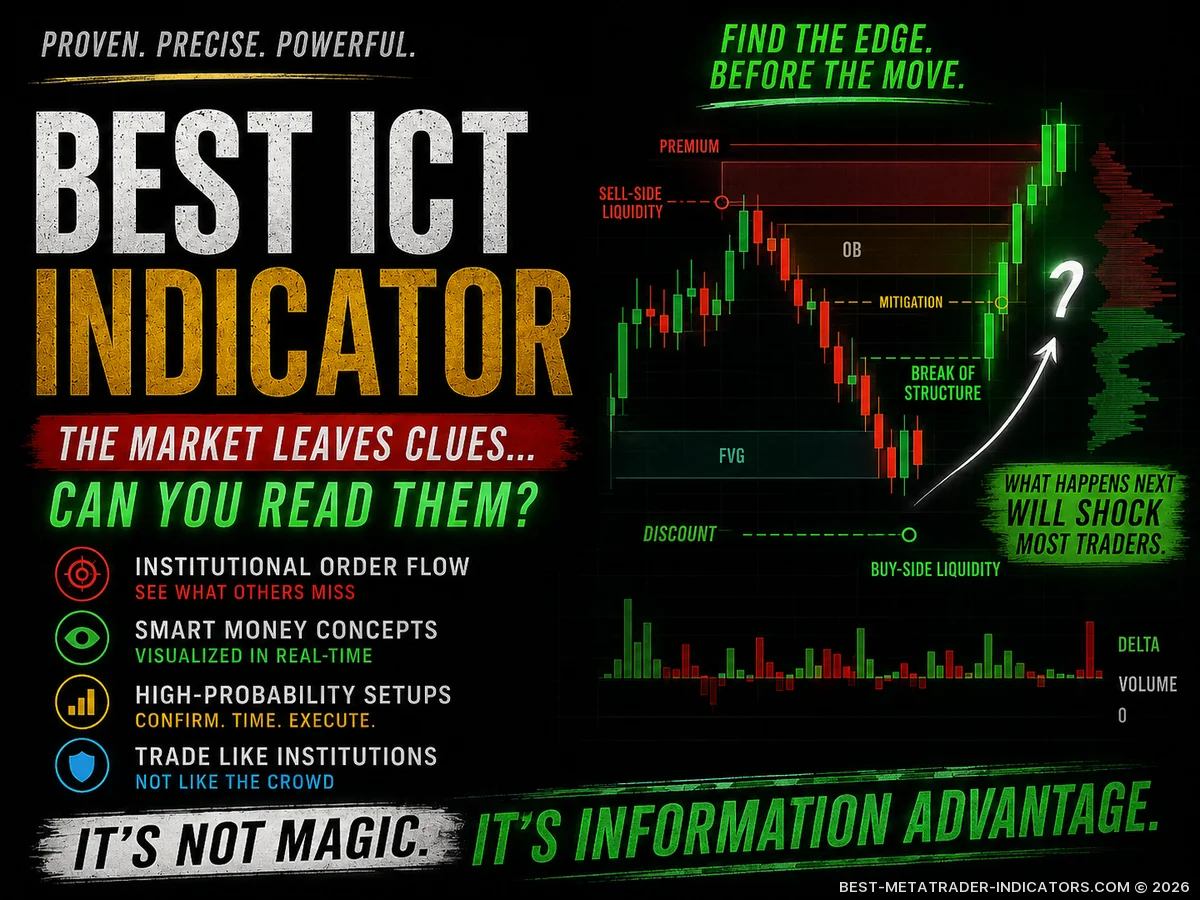
Instead of giving a simple moving average crossover or a basic overbought-oversold signal, an ICT indicator usually highlights areas such as:
- Fair Value Gaps where aggressive price movement leaves an imbalance behind.
- Order Blocks where a strong price leg may have started.
- Liquidity Zones above highs and below lows.
- Market Structure Shifts after a relevant swing high or swing low is broken.
- Premium and Discount Areas for cleaner trade location.
- Kill Zones such as London Open and New York Open trading windows.
Trader note: An ICT indicator should support your analysis, not replace your judgement. The best results usually come when you combine visual zones with session timing, higher-timeframe bias, and strict risk management.
🚀 Premium Trading Solutions for Traders Who Demand More


📊 Why Forex Traders Use ICT Indicators
Forex markets often move in a way that punishes impatient traders. Price may break a previous high, attract breakout buyers, reverse sharply and then run in the opposite direction. This is where ICT concepts become useful, because they train traders to think in terms of liquidity rather than simple trend lines.
💧 Liquidity Awareness
The indicator helps identify areas where stop losses may be resting, especially above equal highs, below equal lows, or near obvious swing points.
📍 Better Trade Location
Instead of chasing price, traders can wait for entries from fair value gaps, order blocks, or discount zones when the bias supports the trade.
🧮 Cleaner Risk Planning
ICT-style setups often provide logical invalidation points, making Stop Loss placement more structured and less emotional.
🔍 Core ICT Concepts the Indicator Can Show
A good ICT indicator should make the chart easier to read, not more confusing. Below are the most important elements to understand before using it in live conditions.
Key ICT concepts and how they can help traders structure better decisions.
| ICT Concept | What It Means | How Traders Use It | Best Use Case |
|---|---|---|---|
| Fair Value GapPrice imbalance | A fast move where price leaves inefficient delivery between candles. | Used as a potential retracement entry zone after displacement. | Trend continuation entries. |
| Order BlockImpulse candle zone | A candle or price area before a strong impulsive move. | Used as a reaction zone after liquidity has been taken. | Reversal or continuation setups. |
| Liquidity SweepStop hunt | Price moves above a high or below a low before reversing. | Used to avoid false breakouts and prepare for reversal entries. | London and New York session setups. |
| Market Structure ShiftDirection change | Price breaks a relevant internal or external structure level. | Used as confirmation that momentum may have shifted. | Confirmation after a liquidity grab. |
| Premium / DiscountTrade location | Price is divided around the midpoint of a dealing range. | Traders prefer buys in discount and sells in premium. | Filtering poor entries. |
⚙️ ICT Indicator Settings for MetaTrader
Most ICT indicators for MetaTrader 4 or MetaTrader 5 allow traders to customize how zones, structure, and liquidity levels are displayed. The best settings depend on your trading style, but the goal should stay the same: keep the chart readable.
🎨 Recommended Visual Settings
- Show only recent fair value gaps.
- Use different colors for bullish and bearish zones.
- Limit order blocks to higher-quality displacement moves.
- Hide weak or outdated zones after mitigation.
- Keep liquidity labels simple and readable.
🔔 Useful Alert Settings
- Alert when price enters a fair value gap.
- Alert after a market structure shift.
- Alert when liquidity above or below a range is taken.
- Alert during London or New York session only.
- Disable alerts during low-volume hours.
Important: Do not overload the chart with every possible ICT feature. Too many zones can create analysis paralysis very quickly. A clean chart with three or four meaningful levels is often more useful than a chart covered with signals.
🎯 ICT Indicator Trading Strategy: Liquidity Sweep + FVG Entry
One of the most practical ICT-based strategies is the liquidity sweep plus fair value gap entry. The idea is simple: wait for price to take liquidity, confirm a shift in momentum, and then look for a retracement into an imbalance zone.
🪜 Step-by-Step Setup
- Mark the higher-timeframe bias on H1 or H4.
- Identify obvious liquidity above highs or below lows.
- Wait for price to sweep that liquidity during an active session.
- Look for displacement in the opposite direction.
- Wait for price to return into the fair value gap.
- Enter only if the risk-to-reward profile is acceptable.
- Place the Stop Loss beyond the liquidity sweep.
- Target the next opposing liquidity pool or structure level.
Example idea: If EUR/USD sweeps a previous session high, forms bearish displacement, and leaves a fair value gap on M5, a trader may wait for price to retrace into that FVG before looking for a short entry. The Stop Loss can sit above the sweep high, while Take Profit may target the next internal low or the next clear liquidity area.
🚨 Most Free MetaTrader Indicators Miss This Advantage
⏰ Best Time Frames for ICT Indicator Trading
ICT concepts can be used on many time frames, but the cleanest results usually come when traders combine a higher-timeframe bias with lower-timeframe execution. That helps avoid the mistake of taking every small signal without context.
| Trading Style | Bias Time Frame | Entry Time Frame | Typical Target |
|---|---|---|---|
| Scalping | M15 / M30 | M1 / M5 | 5-20 pips |
| Day Trading | H1 / H4 | M5 / M15 | 20-80 pips |
| Swing Trading | D1 / H4 | H1 / M30 | 100+ pips |
💡 Practical ICT Trading Ideas
🌊 Idea 1: Session Liquidity Sweep
Watch the Asian range high and low. If the active session sweeps one side and rejects strongly, the opposite side of the range can become a logical target.
➡️ Idea 2: Session Continuation
If the first major session creates a clean directional move, the next session may retrace into a fair value gap before continuing toward the next liquidity pool.
🔁 Idea 3: Order Block Retest
After a market structure shift, price may return to the last opposing candle before displacement. This can create a cleaner entry zone with a better-defined invalidation point.
⚖️ Idea 4: Premium and Discount Filter
Avoid buying in premium and avoid selling in discount unless there is strong confirmation. Good location matters more than being early.
🛡️ Risk Management with ICT Indicators
ICT-style trading can look very accurate on historical charts, but live execution is different. Spreads widen, price taps zones without filling orders, and some setups simply fail without warning. That is why risk management is not optional.
- Risk only a small percentage per trade, especially during fast or unstable sessions.
- Place the Stop Loss beyond the invalidation point, not at a random pip distance.
- Do not move the Stop Loss closer just because price hesitates for a few candles.
- Take partial profits at logical liquidity targets when your plan allows it.
- Avoid entering if the Stop Loss is too wide for your account size or risk limit.
- Do not revenge trade after a failed liquidity sweep setup.
Professional reminder: A beautiful ICT setup is still only a probability, not a promise. If the Stop Loss is too large, the spread is poor, or the session is flat, skipping the trade is often the best decision.
🧩 ICT Indicator vs Traditional Indicators
Traditional indicators such as moving averages, RSI, and MACD are often based on calculations from previous price action. ICT indicators are different because they focus more on price delivery, liquidity, and structure. Both approaches can work, but they require different thinking and different execution rules.
A practical comparison between ICT indicators and traditional technical indicators.
| Feature | ICT Indicator | Traditional Indicator | Trader Comment |
|---|---|---|---|
| Market LogicStructure-based | Focuses on liquidity, imbalance and liquidity-driven price movement. | Focuses on mathematical calculations from past price. | ICT can feel more discretionary, but it also gives more context. |
| SignalsZone-based | Highlights areas where traders may prepare for entries. | Often gives direct buy or sell signals. | ICT requires more patience, confirmation, and trade selection. |
| Best StrengthTrade location | Helps avoid chasing price after obvious breakouts. | Can help confirm trend or momentum when used carefully. | Combining both can be useful, provided the chart stays clean. |
| WeaknessLearning curve | Can confuse beginners when too many concepts are shown at once. | Can lag during fast market shifts. | Backtesting and demo testing are essential for both. |
📌 ICT Indicator Checklist Before Entering a Trade
Use this checklist before clicking buy or sell. It keeps the process objective and reduces emotional entries.
- Is the higher-timeframe bias clear?
- Has price taken meaningful liquidity?
- Did displacement confirm momentum?
- Is there a clean fair value gap or order block?
- Is the entry in premium or discount according to the trade direction?
- Is the Stop Loss placed beyond invalidation?
- Is the Take Profit based on real liquidity, not hope?
- Is the risk-to-reward at least acceptable for your plan?
- Are you trading during a high-quality, active session?
- Are you calm enough to accept the loss if the setup fails?
🚫 Common Mistakes When Using ICT Indicators
🏃 Chasing Every Fair Value Gap
Not every imbalance is worth trading. The best fair value gaps usually appear after liquidity has been taken and displacement is obvious.
⏫ Ignoring the Higher Time Frame
Many beginners take M1 and M5 signals against the H1 or H4 direction. This creates unnecessary losses and confusion.
🧱 Using Too Many Concepts
Order blocks, breakers, mitigation blocks, FVGs, and liquidity labels can overload the chart. Start with the basics first and add complexity only when your execution is consistent.
🌫️ Trading During Bad Conditions
ICT setups need movement. Dead sessions and low-volatility conditions can make even good zones fail repeatedly.
🧘 Trading Psychology: Patience Is the Real Edge
The ICT approach is attractive because it offers a logical map of price movement. But the real challenge is psychological. You may identify the right liquidity level and still enter too early. You may identify the fair value gap and still close the trade before it plays out. You may see a clean setup and over-risk because you feel too confident.
Professional traders treat the ICT indicator as a filter, not as permission to gamble. They wait for price to reach their area, demand confirmation, and accept that many sessions will produce no trade at all.
Mindset rule: The best ICT trade is usually not the one you force. It is the one that comes to your level, confirms your bias, and gives you a clean invalidation point.
🔍 Premium Indicators for Forex, Gold, Crypto and Indices
❓ ICT Indicator FAQ
🎓 Is an ICT indicator good for beginners?
Yes, but only if beginners start with simple concepts such as liquidity sweeps, fair value gaps and market structure shifts. Trying to learn every ICT term at once can become overwhelming and usually slows progress.
🔄 Does the ICT indicator repaint?
It depends on the specific indicator. Some structure or swing-based tools may update as new candles form. Always test the indicator in replay mode and live demo conditions before using real capital.
💱 Which pairs work best with ICT concepts?
Major Forex pairs such as EUR/USD, GBP/USD, and USD/JPY are popular because they usually have strong liquidity and cleaner technical behavior.
🥇 Can I use ICT indicators for gold?
Yes. XAU/USD can work very well with liquidity and fair value gap concepts, but volatility is higher, so position sizing and Stop Loss placement must be handled carefully.
⏱️ What is the best session for ICT trading?
Many traders focus on the London and New York opens because liquidity and volatility are usually stronger during those periods.
🧠 Can ICT indicators replace manual analysis?
No. They can speed up chart reading, but traders still need context, bias, timing, and risk control. The indicator should support your trading plan, not become the plan.
🏁 Final Thoughts on the ICT Indicator
The ICT Indicator can be a powerful tool for Forex traders who want to understand price through liquidity, structure, and cleaner price delivery. It can help identify fair value gaps, order blocks, liquidity sweeps, and market structure shifts more efficiently. But it should never be treated as a shortcut to guaranteed profits.
The real edge comes from combining the indicator with a clear higher-timeframe bias, disciplined session selection, patient execution, and professional risk management. If you use it as a structured decision tool, it can improve your chart reading and help you avoid many of the emotional mistakes that damage trading accounts.
Disclaimer: This article is for educational purposes only and does not provide financial advice. Trading Forex, CFDs and leveraged products involves risk. Always test every indicator and strategy on a demo account first, define your Stop Loss before entry and never risk money you cannot afford to lose.