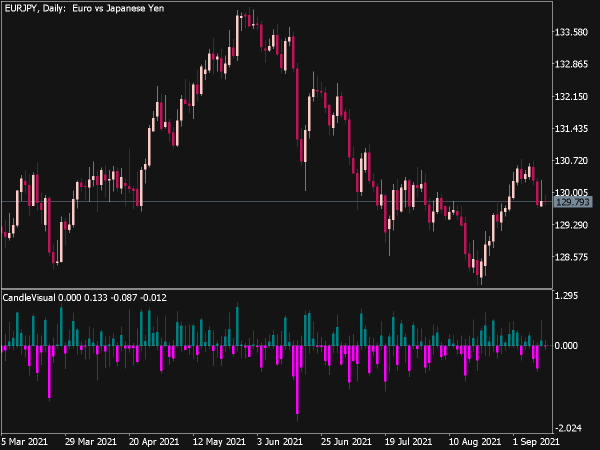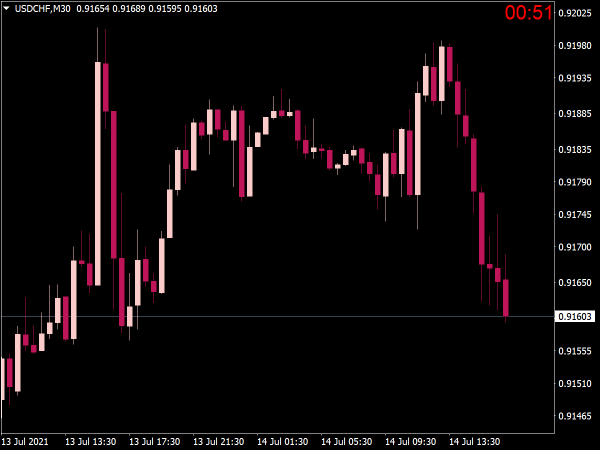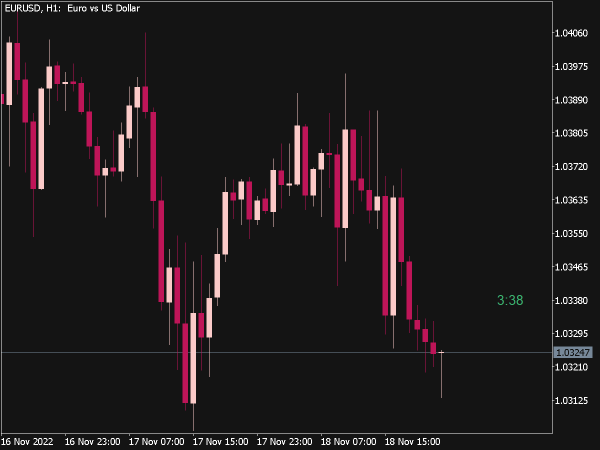
Candlestick patterns are one of the most useful visual tools in Forex trading because they compress market psychology into a single candle or a small group of candles. A wick shows rejection. A body shows commitment. A close shows who won the battle for that session. When you learn to read these details in context, price action starts to look less random and more like a sequence of decisions made under pressure.
But here is the truth many beginners miss: a candlestick pattern alone is not a complete trading strategy. A bullish engulfing candle in the middle of nowhere is just a candle. The same candle at a higher-timeframe support zone, after a liquidity sweep, with improving momentum and a clean risk-to-reward profile can become a trade idea worth planning.
🧠 What Candlestick Patterns Really Tell You
A candlestick shows four key prices: open, high, low, and close. The body shows the distance between open and close. The wick shows how far price moved before being rejected. In Forex, this matters because currencies often push through visible liquidity zones before choosing direction.
Experienced traders do not look at candles as isolated shapes. They ask better questions: Who is trapped? Who is in control? Was a level rejected? Did the candle close with authority? Is the move happening at support, resistance, trend continuation, or exhaustion?
Market Intent
Large candle bodies often show commitment. Small bodies often show hesitation. Strong closes near the high or low can reveal conviction, especially when they appear after a clean structural reaction.
Rejection
Long wicks can show that price entered a zone, found opposing orders, and failed to continue in that direction. The close tells you whether that rejection had real follow-through.
Timing
Candlestick patterns can help refine entries after your higher-timeframe analysis has already identified a valid trade area. They should not be used as random buy or sell buttons.
📌 The Golden Rule: Context Comes First
The same candlestick pattern can mean different things depending on where it forms. A hammer at support may suggest bullish rejection. A hammer after a long extended rally may simply be noise. A bearish engulfing candle at resistance may matter. A bearish engulfing candle inside a choppy range may fail quickly.
Professional trading idea: Treat candlestick patterns as confirmation tools, not prediction tools. First define market structure, trend, key levels, volatility, and session timing. Then use the candle pattern to improve entry precision.
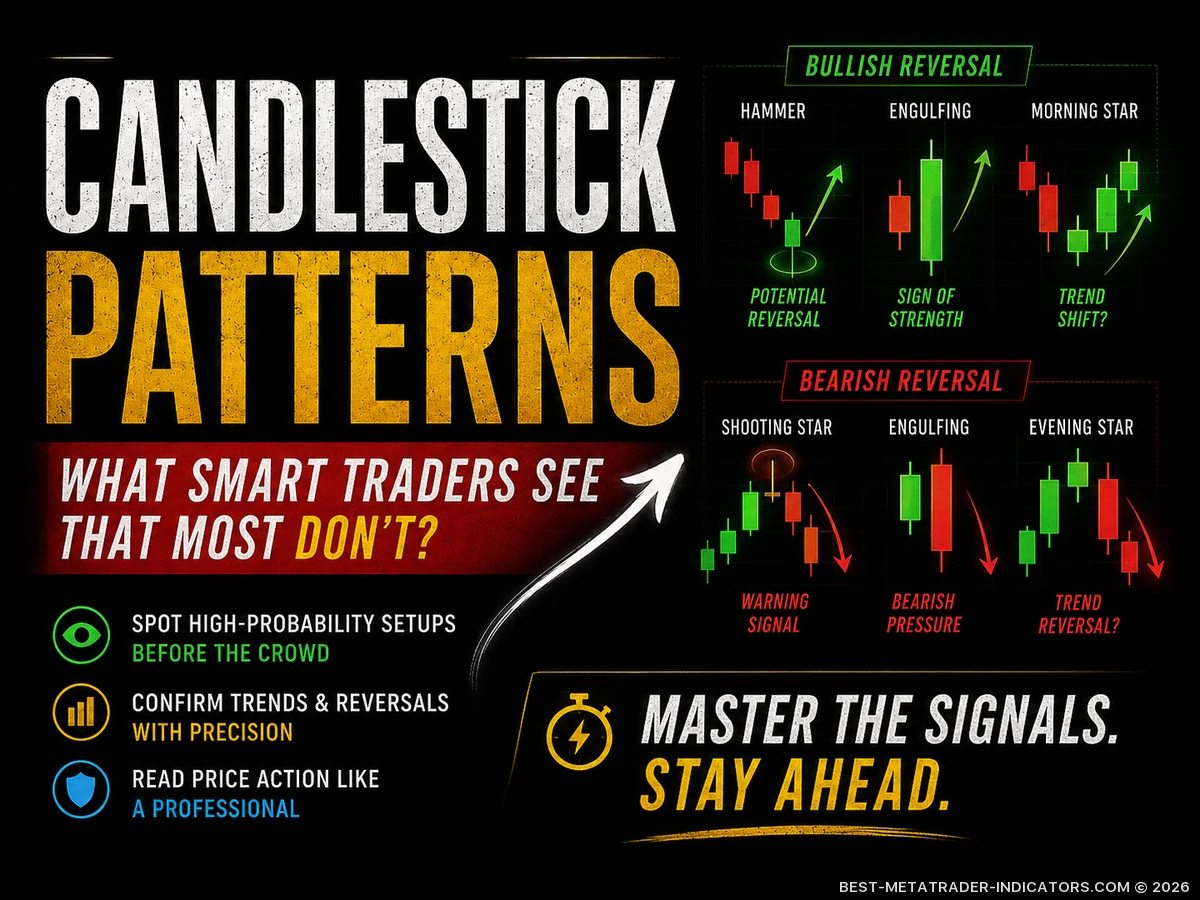
🔥 Most Important Bullish Candlestick Patterns
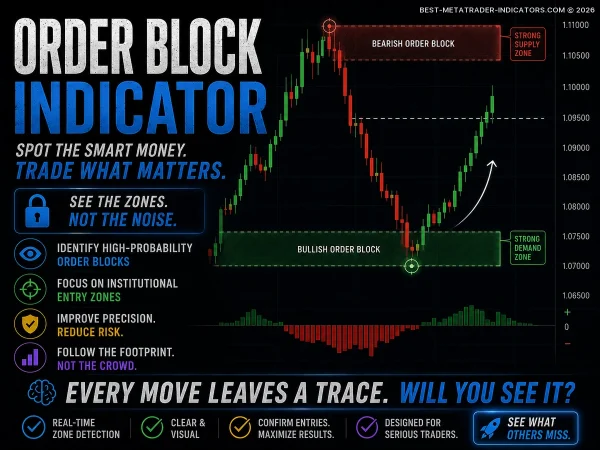
Bullish patterns suggest that sellers may be losing control and buyers may be stepping in. They work best near support, demand zones, trendline retests, previous lows, round numbers, or after a liquidity sweep below a key level.
| Pattern | What It Suggests | Best Location | Trader’s Note |
|---|---|---|---|
| Hammer | Lower prices were rejected and buyers defended the area. | Support, demand zone, previous swing low. | Stronger when the candle closes in the upper third of its range. |
| Bullish Engulfing | Buyers overwhelmed the previous bearish candle. | After a pullback in an uptrend or at major support. | Look for momentum, structure, or MetaTrader indicator confirmation. |
| Morning Star | Selling pressure slows, hesitation appears, then buyers take control. | After a bearish move into support. | The third candle should close strongly for better confirmation. |
| Piercing Pattern | Buyers recover a large part of the previous bearish candle. | Demand zones and oversold pullbacks. | Less aggressive than engulfing, but useful with confluence. |
🐻 Most Important Bearish Candlestick Patterns
Bearish patterns suggest that buyers may be losing momentum and sellers may be entering the market. They are most useful near resistance, supply zones, previous highs, failed breakouts, or after price sweeps liquidity above a level.
| Pattern | What It Suggests | Best Location | Trader’s Note |
|---|---|---|---|
| Shooting Star | Higher prices were rejected and sellers pushed price back down. | Resistance, supply zone, previous swing high. | More reliable when it appears after an extended bullish move. |
| Bearish Engulfing | Sellers took control and erased the previous bullish candle. | Resistance or pullback in a downtrend. | A close near the low adds strength to the signal. |
| Evening Star | Buying pressure fades, indecision forms, then sellers dominate. | After a bullish move into resistance. | Useful for reversal trades, but avoid fading a strong trend without structural confirmation. |
| Dark Cloud Cover | Sellers push deeply into the prior bullish candle. | Supply zones, range highs, failed breakouts. | Works better when followed by bearish continuation. |
⚖️ Reversal vs Continuation Patterns
Not every candlestick pattern is a reversal signal. Some patterns warn that the current move may continue after a pause. This distinction is critical because many losing trades happen when traders fight a strong trend too early.
Use this comparison to avoid confusing exhaustion with continuation.
| Type | Common Patterns | Market Message | Best Use |
|---|---|---|---|
| ReversalPotential change of direction | Hammer, Shooting Star, Engulfing, Morning Star, Evening Star | The current side may be losing control. | At strong support or resistance after an extended move. |
| ContinuationPause before trend resumes | Inside Bar, Marubozu, Rising/Falling Three Methods | The market may be resting before continuation. | During pullbacks inside a clear trend. |
| IndecisionNo clear winner yet | Doji, Spinning Top, Small-bodied candles | Buyers and sellers are temporarily balanced. | Wait for the next candle close or a breakout. |
🚀 Strategy 1: Support and Resistance Rejection
This is one of the cleanest ways to use candlestick patterns. First mark major support and resistance on the higher timeframe. Then wait for price to reach the level. Do not enter just because price touches the zone. Wait for a rejection candle such as a hammer, shooting star, engulfing candle, or strong close away from the level.
Example Trade Idea
- Identify a strong support level on the 4-hour chart.
- Wait for price to sweep below the level and return above it.
- Look for a bullish engulfing candle or hammer on the 1-hour or 30-minute chart.
- Place stop loss below the rejection wick.
- Target the next resistance area or a minimum 1:2 risk-to-reward ratio.
📈 Strategy 2: Trend Pullback Continuation
In a strong trend, the best candlestick patterns often appear during pullbacks. For example, in an uptrend, price may pull back into a moving average, previous structure, or Fibonacci retracement zone. A bullish engulfing candle or strong rejection wick can then provide a continuation entry.
For Long Trades
- Higher highs and higher lows are visible.
- Price pulls back into support or a dynamic moving average.
- A bullish candle confirms buyer reaction.
- Stop loss goes below the pullback low.
For Short Trades
- Lower highs and lower lows are visible.
- Price pulls back into resistance or supply.
- A bearish candle confirms seller reaction.
- Stop loss goes above the pullback high.
💧 Strategy 3: Liquidity Sweep and Reversal
Forex markets often move beyond obvious highs and lows before reversing. This is sometimes called a liquidity sweep or stop hunt. A candlestick with a long wick beyond a key level can show that stops were triggered, liquidity was collected, and price failed to continue.
Practical idea: If EUR/USD breaks above yesterday’s high, forms a shooting star, and closes back below the level, the breakout may have failed. This does not automatically mean you should short, but it gives you a reason to look for confirmation on a lower timeframe.
🛡️ Risk Management Rules for Candlestick Trading
Even the best pattern will fail. The difference between a professional and a gambler is not the pattern they use, but how they control risk when the pattern does not work.
Never Ignore Risk
A beautiful candlestick setup with poor risk management is still a poor trade. Always define your invalidation point before entering. If the market reaches that point, the trade idea is wrong.
Risk Per Trade
Many disciplined traders risk only a small percentage of capital per trade. The goal is survival first, profit second, because one oversized position can damage weeks of good execution.
Stop Placement
Do not place stops randomly. Use the candle wick, structure, volatility, and spread conditions to define a logical stop. The stop loss should sit where the setup is invalidated, not where the position size feels comfortable.
✅ Candlestick Trading Checklist
Before entering a trade based on a candlestick pattern, go through this checklist. If too many answers are weak, skip the trade. The market will always provide another setup.
- Is the pattern forming at a meaningful support, resistance, supply, or demand zone?
- Does the higher timeframe support the trade direction?
- Is the candle close strong enough, or is the signal still uncertain?
- Is there enough room to the next target area?
- Is the risk-to-reward ratio acceptable?
- Are you trading during a liquid session?
- Are current spread and volatility conditions suitable for the setup?
- Do you know exactly where your stop loss and take profit are?
- Are you entering because of a plan, not because of fear of missing out?
🧩 Best Confluence Factors
Candlestick patterns become more powerful when combined with other evidence. This does not mean adding ten indicators to your chart. It means building a simple case where several independent factors point in the same direction.
Structure
Higher highs, lower lows, break of structure, and retests help define the market environment.
Key Levels
Major support and resistance zones give candlestick patterns a meaningful location.
Session Timing
London and New York sessions often provide cleaner momentum and better liquidity than quiet periods.
📊 Candlestick Patterns: Advantages and Disadvantages
| Advantages | Disadvantages |
|---|---|
| Easy to read visually once you understand the basics. | Can produce many false signals in choppy markets. |
| Useful for timing entries and exits. | Weak when used without market structure or key levels. |
| Works across currency pairs and timeframes. | Lower timeframes can be noisy and spread-sensitive. |
| Helps traders understand buyer and seller behavior. | Patterns are subjective and require practice. |
🧪 Common Beginner Mistakes
Most candlestick losses come from poor context, emotional entries, or bad risk management. The patterns themselves are not the problem. The problem is usually how traders use them.
Entering Too Early
A candle is not confirmed until it closes. Many beginners enter while the candle is still forming, only to watch the signal disappear before the close.
Ignoring the Trend
Trying to short every shooting star in a strong uptrend can be expensive. Reversal patterns need exhaustion and location.
Trading Every Pattern
Not every pattern deserves a trade. Quality setups are selective. Patience is part of the edge.
Using Tight Stops
Stops placed too close to the entry often get hit by normal market noise, especially on volatile pairs.
📝 Practical Tips from a Price Action Perspective
- Start with the higher timeframe. Daily and 4-hour charts help you avoid reacting to small noise.
- Wait for candle close. A pattern is only valid after the candle has completed.
- Mark obvious liquidity. Previous highs, lows, and round numbers often attract price.
- Do not chase large candles. A big candle may look exciting, but the stop may be too wide.
- Journal screenshots. Save the chart before, during, and after the trade to improve pattern recognition.
- Separate signal from execution. A valid signal still needs good entry, stop, target, and position size.
🧭 Simple Candlestick Trading Plan
- Define the bias: Is the market trending, ranging, or reversing?
- Mark key zones: Support, resistance, supply, demand, previous highs and lows.
- Wait for price: Do not trade in the middle of nowhere.
- Watch the candle close: Look for rejection, engulfing, continuation, or indecision.
- Check risk: Confirm that the stop loss and target make sense.
- Execute or skip: A missed trade is better than a forced trade.
- Review: Record the outcome and what the candle actually revealed.
❓ Candlestick Patterns FAQ
Are candlestick patterns reliable in Forex?
They can be useful, but they are not reliable as standalone signals. Their quality depends heavily on trend, location, volatility, session timing, and risk management.
Which candlestick pattern is the best?
There is no single best pattern. Many traders prefer engulfing candles and rejection wicks because they clearly show a shift in control, but context matters more than the name of the pattern.
What timeframe is best for candlestick patterns?
Higher timeframes such as 4-hour and daily charts usually produce cleaner signals. Lower timeframes can work, but they require more experience and faster risk control.
Should I combine candlesticks with indicators?
Yes, but keep it simple. Moving averages, ATR, RSI, or volume-style tools can help, and all of them are practical inside MetaTrader-style workflows. Too many indicators, though, may create confusion instead of clarity.
Can candlestick patterns predict the market?
No pattern predicts the future with certainty. Candlesticks help estimate probability by showing how price reacted at a specific area.
Why do candlestick patterns fail?
They fail because markets are probabilistic. Weak location, poor risk control, thin liquidity, trend strength, and weak confirmation can all invalidate a pattern.
🎯 Final Thoughts
Candlestick patterns are powerful because they make market psychology visible. They show rejection, momentum, hesitation, and control. But they become truly useful only when you combine them with structure, key levels, risk management, and patience.
The goal is not to memorize every pattern in a textbook. The goal is to understand what the candle is telling you at the exact place where it forms. When you stop seeing candles as signals and start seeing them as evidence, your trading decisions become clearer, calmer, and more professional.
Trade the story, not just the shape.
Risk disclaimer: Trading Forex and CFDs involves risk and may not be suitable for every trader. Candlestick patterns, indicators, Stop Loss levels, and Take Profit targets can support decision-making, but they do not guarantee results. Always trade with a defined plan, controlled position size, and capital you can afford to risk.