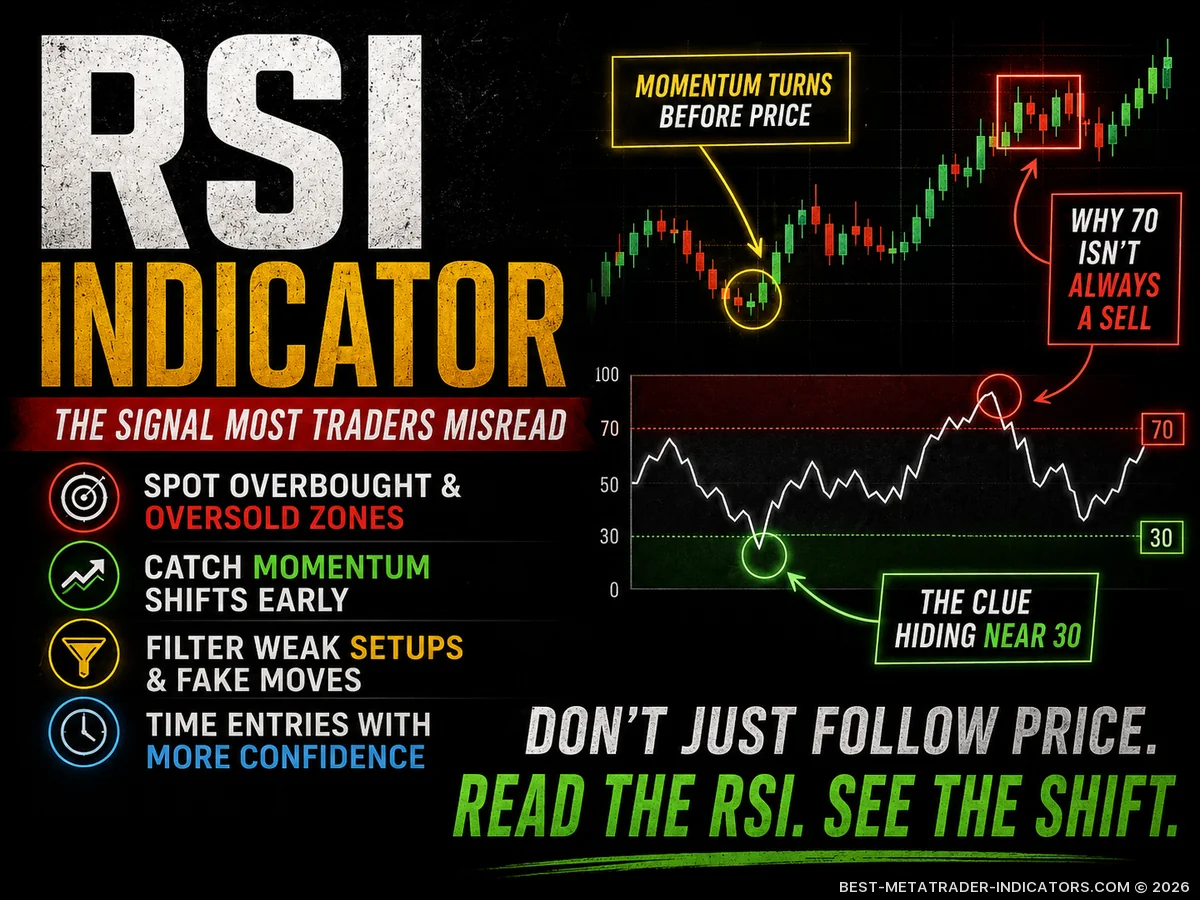
The Relative Strength Index, better known as RSI, is one of the most widely used momentum indicators in trading. But popularity does not make an indicator profitable by itself. Many beginners treat RSI as a simple “buy below 30, sell above 70” tool, then find themselves trapped when price keeps moving against the signal.
After years of watching markets trend, range, fake out, reverse, and punish rushed entries, one point becomes clear: RSI is not a magic signal generator. It is a context tool. Used properly, it can help you judge momentum, timing, trend strength, pullback quality, and market exhaustion. Used blindly, it becomes just another reason to enter too early.
📌 What Is the RSI Indicator?
The RSI indicator was developed by J. Welles Wilder to measure the speed and change of price movements. It moves between 0 and 100 and is most commonly calculated over 14 periods, which makes it compatible with standard MetaTrader setups.
In practical terms, RSI answers one question that matters on a live chart: is the current move gaining strength, losing strength, or resetting before the next push?
| RSI Level | Common Interpretation | Professional View |
|---|---|---|
| Above 70 | Overbought | Strong bullish momentum, with exhaustion only relevant if price starts to stall |
| Below 30 | Oversold | Strong bearish momentum, with bounce potential only if sellers begin to weaken |
| Around 50 | Neutral | Momentum balance point; often useful as a clean trend filter |
| 40–60 | Sideways zone | Market may be ranging, pausing, or building pressure before a breakout |
Trader’s note: RSI does not tell you whether price is “too high” or “too low” in absolute terms. It measures recent momentum. A strong trend can keep RSI overbought or oversold far longer than an impatient trader expects.
✅ Stop Guessing. Start Trading with Clearer Signals.


🧠 Why RSI Matters in Trading
Markets often move in waves: impulse, pause, pullback, continuation, and sometimes reversal. RSI helps you judge whether a wave is still healthy, stretched, weakening, or preparing for another continuation attempt.
Momentum Reading
RSI shows whether buyers or sellers are pressing with strength. That helps traders avoid stepping in front of powerful momentum too early.
Pullback Timing
In trending markets, RSI can help identify controlled pullbacks instead of forcing entries after a large candle has already run.
Exhaustion Warning
When price makes a new high or low but RSI fails to confirm it, the move may be losing energy beneath the surface.
📊 The Classic RSI Settings
The standard RSI setting is 14 periods. On a daily chart, that means 14 daily candles. On a 1-hour chart, it means 14 hourly candles. The lower the period, the more sensitive RSI becomes. The higher the period, the smoother and slower it becomes.
| Setting | Behavior | Best Used For |
|---|---|---|
| RSI 7 | Fast and sensitive | Scalping, aggressive entries, and short-term momentum shifts |
| RSI 14 | Balanced standard | Most trading strategies and multi-timeframe analysis |
| RSI 21 | Smoother and slower | Swing trading, trend confirmation, and fewer false signals |
⚙️ How Professional Traders Read RSI Differently
Beginners usually ask: “Is RSI overbought or oversold?” Experienced traders ask better questions:
- Is the market trending or ranging?
- Is RSI confirming price action?
- Is momentum expanding or fading?
- Is RSI holding above or below the 50 line?
- Is there divergence at a meaningful support or resistance zone?
- Is the signal aligned with the higher timeframe?
Important warning: Do not short a strong uptrend only because RSI is above 70. Do not buy a collapsing market only because RSI is below 30. Overbought can become more overbought. Oversold can become more oversold.
🚀 RSI Strategy 1: Trend Pullback Strategy
This is one of the most practical RSI strategies because it avoids fighting the dominant move. Instead of using RSI to predict tops and bottoms, you use it to enter pullbacks in the direction of the prevailing structure.
Setup Rules
- Identify a clear uptrend or downtrend on the higher timeframe.
- In an uptrend, wait for RSI to pull back toward the 40–50 area.
- In a downtrend, wait for RSI to bounce toward the 50–60 area.
- Look for price action confirmation: rejection candle, structure break, or support/resistance reaction.
- Enter only when price confirms that the pullback is ending.
In strong uptrends, RSI often does not reach 30. It may simply reset around 40 or 50 before price continues higher. In strong downtrends, RSI may fail near 50 or 60 before sellers take control again. This is why the 50 line is so useful.
🔁 RSI Strategy 2: Divergence Reversal Strategy
RSI divergence appears when price and RSI disagree. It is not an automatic trade signal, but it can be a serious warning that momentum is weakening and the current move needs closer attention.
Bullish Divergence
Price makes a lower low, but RSI makes a higher low. Sellers are still pushing price down, but the pressure behind the move may be fading.
Bearish Divergence
Price makes a higher high, but RSI makes a lower high. Buyers are still lifting price, but the momentum behind that push may be weakening.
The best RSI divergence setups appear near major support, resistance, trendline zones, previous highs/lows, or psychological price levels. Divergence in the middle of random price action is much less reliable.
🎯 RSI Strategy 3: The 50-Line Momentum Filter
The RSI 50 line is often ignored, yet it is one of the cleanest ways to read momentum bias. When RSI holds above 50, buyers usually control the rhythm. When RSI holds below 50, sellers usually control the rhythm.
Simple filter: Look for long setups when RSI is above 50 and price structure supports bullish continuation. Look for short setups when RSI is below 50 and price structure supports bearish continuation.
🧩 RSI Strategy 4: RSI + Support and Resistance
RSI becomes more useful when combined with price levels. A market testing support while RSI is oversold may create a better bounce setup than RSI alone. A market pressing into resistance while RSI shows bearish divergence may offer a cleaner short idea.
Long Idea
- Price reaches a known support zone.
- RSI is oversold or forming bullish divergence.
- A bullish candle confirms rejection.
- Stop-loss goes below the invalidation level.
Short Idea
- Price reaches a known resistance zone.
- RSI is overbought or forming bearish divergence.
- A bearish candle confirms rejection.
- Stop-loss goes above the invalidation level.
🔥 Institutional-Grade Trading Indicators for MT4 & MT5
📈 RSI in Trending vs Ranging Markets
The same RSI reading can mean different things depending on market condition. This is where many traders get trapped, especially when they read the indicator without reading structure first.
RSI Behavior by Market Type
Understanding market condition matters more than memorizing indicator levels.
| Market Type | RSI Behavior | Better Approach | Main Risk |
|---|---|---|---|
| Strong UptrendHigher highs and higher lows | RSI may stay above 50 and repeatedly touch 70 | Buy pullbacks, avoid early shorts | Selling too soon |
| Strong DowntrendLower highs and lower lows | RSI may stay below 50 and repeatedly touch 30 | Sell rallies, avoid early longs | Buying too soon |
| Range MarketPrice rotates between support and resistance | RSI often swings between 30 and 70 | Fade extremes near key levels | Trading after a breakout starts |
| Breakout MarketVolatility expansion | RSI can remain extreme for longer than expected | Wait for retest or continuation structure | Assuming extreme RSI means reversal |
✅ RSI Trading Checklist
Before taking an RSI-based trade, run through this checklist. It can save you from many low-quality entries that look tempting for a few seconds and weak after review.
- Is the higher timeframe trend clear?
- Is price near a meaningful level?
- Is RSI giving a momentum clue, not just an isolated number?
- Is there confirmation from price action?
- Is the stop-loss placed at a logical invalidation point?
- Is the reward-to-risk ratio worth the trade?
- Is volatility acceptable for the size of the stop-loss?
- Would I still take this trade if RSI was removed from the chart?
💡 Practical RSI Tips From Trading Experience
Use RSI as a Filter
RSI works best when it supports a trade idea that already makes sense from price action, structure, and risk management.
Watch the 50 Level
The 50 line often separates bullish and bearish momentum. It can help you avoid trading against the pressure currently controlling the chart.
Respect Strong Trends
In a powerful trend, overbought or oversold readings can signal strength, not reversal. Context decides the meaning.
Combine With Structure
Support, resistance, trendlines, swing highs, swing lows, and liquidity zones make RSI signals far more useful.
⚖️ Advantages and Disadvantages of RSI
Advantages
- Easy to understand and widely available in MetaTrader.
- Useful for spotting momentum shifts.
- Can help identify pullbacks and exhaustion.
- Works across multiple markets and timeframes.
- Pairs well with support, resistance, and trend analysis.
Disadvantages
- Can give early reversal signals in strong trends.
- Produces false signals in choppy markets.
- Should not be used alone for entries.
- Many traders misunderstand overbought and oversold levels.
- Settings can become curve-fitted if over-optimized.
🧪 Example Trading Ideas With RSI
| Idea | Condition | Confirmation | Risk Control |
|---|---|---|---|
| Trend Pullback Buy | Uptrend, RSI pulls back toward 40–50 | Bullish rejection candle near support | Stop below swing low |
| Trend Pullback Sell | Downtrend, RSI rejects 50–60 | Bearish structure break | Stop above swing high |
| Bullish Divergence | Price makes lower low, RSI makes higher low | Break above short-term resistance | Stop below divergence low |
| Range Fade | Price at range boundary, RSI extreme | Rejection from support or resistance | Stop outside range |
🚫 Common RSI Mistakes
The RSI indicator is simple, but that simplicity can be dangerous. These are the mistakes that often turn a useful tool into a source of bad entries:
- Entering too early: RSI can become oversold before price actually stops falling.
- Ignoring trend direction: Countertrend RSI trades are harder and require stronger confirmation.
- Using RSI without levels: A signal near support or resistance is more meaningful than a signal in random price space.
- Over-optimizing settings: Changing RSI settings until they fit old charts does not guarantee future performance.
- Ignoring stop placement: A good RSI signal still needs a clear invalidation level and controlled position size.
Risk reminder: Trading involves significant risk. RSI can help structure decisions, but it cannot remove uncertainty. Always use position sizing, stop-loss planning, and a tested strategy.
🛠️ Best RSI Combinations
RSI becomes more powerful when combined with tools that answer different questions. Avoid stacking too many indicators that all measure the same type of momentum.
| Combination | Purpose | Why It Helps |
|---|---|---|
| RSI + Support/Resistance | Entry location | Connects momentum with meaningful price zones |
| RSI + Moving Average | Trend filter | Helps avoid countertrend signals |
| RSI + Price Action | Confirmation | Reduces blind entries from indicator readings |
| RSI + ATR | Risk planning | Helps adapt stops to current volatility |
🧭 A Simple RSI Trading Plan
- Start with the higher timeframe and identify trend direction.
- Mark support, resistance, swing highs, and swing lows.
- Use RSI to evaluate momentum and pullback quality.
- Wait for price action confirmation before entering.
- Place the stop-loss where the trade idea becomes invalid.
- Target a realistic level, not a fantasy move.
- Record the trade and review whether RSI added real value.
📊 Forex Indicators Built for Momentum, Timing & Clarity
❓ RSI Indicator FAQ
Is RSI good for trading?
Yes, RSI can be useful when it is used with market structure, trend direction, and risk management. It should not be treated as a standalone signal.
What is the best RSI setting?
The standard setting is 14 periods. Shorter settings like 7 are more sensitive, while longer settings like 21 are smoother. The best setting depends on your timeframe and strategy.
Should I buy when RSI is below 30?
Not automatically. RSI below 30 means bearish momentum has been strong. A buy setup still needs support, confirmation, and a clear invalidation level.
Should I sell when RSI is above 70?
Not automatically. RSI above 70 can indicate strong bullish momentum. In an uptrend, it may be a sign of strength rather than an immediate short signal.
What is RSI divergence?
Divergence happens when price makes a new high or low but RSI does not confirm it. This can warn that momentum is weakening.
Does RSI work better on higher timeframes?
Higher timeframes often produce cleaner signals because they contain less noise. RSI can also be used on lower timeframes when the trader has strict rules.
🏁 Final Thoughts
The RSI indicator is not about predicting every top and bottom. It is about reading momentum with discipline. The traders who get the most value from RSI are not the ones who blindly buy 30 and sell 70. They are the ones who understand context.
Use RSI to ask better questions: Is momentum supporting my idea? Is the trend still healthy? Is this pullback controlled or dangerous? Is divergence appearing at a level that matters? When RSI becomes part of a complete trading process, it can help you trade with more patience, better timing, and fewer emotional decisions.
In trading, the edge is rarely in one indicator. The edge is in how you interpret information, manage risk, and repeat good decisions over time.
Disclaimer: This article is for educational purposes only and does not constitute financial advice. Trading involves risk, and every decision should be made with a tested plan, appropriate position sizing, and a clear stop-loss.
📌 Great Indicators and Trading Systems for MT4 or MT5
- Top-Rated MetaTrader Indicators


- RSI SigMA Indicator

- Stoch-RSI Indicator

- Directional RSI Indicator

- Inside the Stochastic…

- The Best Indicator for…

- Best Hedge Fund Indicator…

- How Smart Traders Use the Fair…

- All RSI Indicator

- RSI Floating Levels Indicator

- Trend Following Indicator…

- Volume Profile Indicator…

- Order Block Indicator Secrets…

- RSI with RSI Indicator

- DT RSI Sig Indicator

- Cutler RSI Indicator

- Best Beginner Forex Indicators…

- MARSICD Indicator

- Footprint Indicator: The…

- Cuttler RSI Indicator

- The Hidden MACD Indicator…

- Non-Repainting Non-Lagging Indicators