A hedge fund indicator is not a magic buy or sell signal. It is a technical analysis tool that helps traders read positioning pressure, speculative flow, sentiment extremes, and possible trend continuation or reversal areas in currencies, gold, indices, and futures-based markets.
For forex traders, the idea is simple: if large professional traders are aggressively building exposure in one direction, retail traders should at least pay attention. Hedge funds do not always get the market right, but their positioning can reveal useful clues about momentum, crowded trades, reversal risk, and the strength behind a technical trend.
📌 What Is a Hedge Fund Indicator?
A hedge fund indicator is a tool or data-based signal that attempts to show how large speculative traders, institutional funds, or leveraged market participants are positioned. In forex trading, this usually means studying futures positioning, net long and short exposure, sentiment extremes, and changes in institutional-style flow as part of a technical trading plan.
The most common foundation for this type of analysis is the Commitments of Traders report, also known as the COT report. Traders use it to analyze how different participant groups are positioned in futures markets such as EUR futures, GBP futures, JPY futures, gold futures, oil futures, and stock index futures, then compare that information with price action on their charts.
Important: A hedge fund indicator should be used as a technical context tool, not as a standalone entry signal. It works best when combined with price action, support and resistance, trend structure, MetaTrader indicators, stop loss planning, take profit levels, and disciplined risk management.
💎 Premium Trading Solutions for Traders Who Demand More


🧠 Why Hedge Fund Positioning Matters in Technical Trading
Forex markets often move in waves of positioning, liquidity, trend continuation, and stop-driven reversals. Hedge funds and other large speculative players can leave traces in positioning data, while the chart itself shows whether that pressure is actually being accepted or rejected by price.
When institutional positioning changes sharply, it can suggest that a stronger technical bias is building. For example, if leveraged funds increase exposure in one currency while price breaks structure in the same direction, the move may have more weight than a normal short-term candle spike.
📈 Trend Confirmation
If hedge fund positioning supports the current price trend, the move may have stronger participation behind it.
🔄 Reversal Warning
If positioning becomes extremely crowded, the market may be vulnerable to a sharp reversal or squeeze.
⚠️ Sentiment Filter
Positioning data helps traders avoid entering late when too much exposure is already on the same side.
📊 How a Hedge Fund Indicator Usually Works
Most hedge fund indicators convert institutional positioning data into a visual format. Instead of manually reading raw futures reports, traders can view lines, histograms, sentiment gauges, or net positioning charts directly on their platform.
A typical hedge fund indicator may show:
- Net long or net short positioning of large speculators or leveraged funds.
- Position changes from the previous reporting period.
- Extreme positioning zones where the market may be overcrowded.
- Historical comparison of current positioning versus previous months or years.
- Divergence between price action and institutional positioning.
Warning: Institutional positioning data is usually delayed. It is useful for bigger-picture technical analysis, but it is not designed for ultra-fast scalping entries or impulsive trades without chart confirmation.
🏦 Hedge Funds vs Retail Traders
Retail traders often focus on indicators such as moving averages, RSI, MACD, Bollinger Bands, and chart patterns. Professional traders usually go further by combining positioning, liquidity zones, volatility, order flow clues, market structure, and clear invalidation levels.
This does not mean retail traders cannot benefit from hedge fund-style analysis. It means the trader must understand the purpose of the tool: it gives technical context, not certainty.
Hedge Fund Indicator vs Standard Retail Indicator
This comparison shows why institutional positioning tools are different from normal technical indicators.
| Tool Type | Main Purpose | Best Use | Weakness |
|---|---|---|---|
| Hedge Fund IndicatorInstitutional positioning | Shows large trader exposure and sentiment | Swing trading, market structure, trend confirmation | Data can be delayed and needs interpretation |
| Moving AverageTrend following | Shows average price direction | Trend filtering and dynamic support/resistance | Can lag during fast reversals |
| RSIMomentum oscillator | Shows overbought or oversold conditions | Mean reversion and divergence setups | Can stay extreme during strong trends |
| Volume IndicatorActivity filter | Shows participation and market activity | Breakout validation and liquidity analysis | Forex spot volume is often broker-based |
🔍 The Best Markets for Hedge Fund Indicator Analysis
Hedge fund positioning is especially useful in markets where futures data is actively tracked and where price respects clear technical zones. Forex traders often monitor currency futures as a proxy for positioning pressure in major currency pairs.
| Market | Related Forex Pair | Why It Matters |
|---|---|---|
| Euro Futures | EUR/USD | Useful for tracking institutional euro sentiment. |
| British Pound Futures | GBP/USD | Helps identify sterling positioning and directional bias. |
| Japanese Yen Futures | USD/JPY | Useful for tracking yen positioning, reversals, and strong trend phases. |
| Australian Dollar Futures | AUD/USD | Useful for tracking AUD positioning, momentum pressure, and trend exhaustion. |
| Gold Futures | XAU/USD | Shows speculative positioning in a highly technical market watched by XAU/USD traders. |
📈 Strategy 1: Trend Confirmation With Hedge Fund Positioning
One of the cleanest ways to use a hedge fund indicator is as a trend confirmation filter. If price is making higher highs and higher lows while institutional positioning is also becoming increasingly bullish, the trend may have stronger support.
How to Trade It
- Identify the dominant trend on the daily or weekly chart.
- Check whether hedge fund positioning supports the same direction.
- Wait for a pullback into support, moving average, or demand zone.
- Enter only after price action confirms continuation.
- Place the stop loss beyond the invalidation level, not randomly.
Example: If EUR/USD is trending higher and euro futures positioning shows large speculators increasing net long exposure, a trader may prefer long setups on pullbacks instead of trying to short every resistance level.
🔄 Strategy 2: Crowded Trade Reversal Setup
Markets often reverse when too many traders are positioned on the same side. A hedge fund indicator can help identify these crowded trades. Extreme net long positioning does not automatically mean the market must fall, but it can warn that fresh buyers may be limited.
Bearish Crowding Signal
Price is still rising, but hedge fund long exposure is at an extreme. If price breaks key support, a long liquidation move may begin.
Bullish Squeeze Signal
Large funds are heavily short, but price stops falling. If resistance breaks, short covering can create a fast upside move.
This strategy works best when positioning extremes combine with technical exhaustion, divergence, failed breakouts, or major support and resistance zones.
🧲 Strategy 3: Price and Positioning Divergence
Divergence between price and hedge fund positioning can be powerful. For example, if price is making new highs but institutional positioning is no longer increasing, it may suggest that the trend is losing sponsorship.
Professional tip: Do not trade divergence too early. Divergence can last for weeks. Wait for a break of market structure, a failed breakout, or a strong rejection candle before entering.
Common Divergence Types
- Bearish divergence: Price makes a new high, but institutional net long positioning does not confirm.
- Bullish divergence: Price makes a new low, but institutional net short positioning does not expand.
- Accumulation divergence: Price moves sideways while positioning quietly improves.
- Distribution divergence: Price remains strong while large traders gradually reduce exposure.
⚙️ Strategy 4: Hedge Fund Indicator + Technical Analysis
The best results usually come from combining institutional positioning with classic technical analysis. A hedge fund indicator may tell you what larger traders are doing, but the chart tells you where the trade can be executed.
1. Bias
Use hedge fund positioning to define whether the market has bullish, bearish, or neutral pressure behind the chart.
2. Zone
Use support, resistance, supply and demand, order blocks, or trendlines to find the trade location.
3. Trigger
Use price action, candle confirmation, break and retest, or momentum shift to enter the trade.
🚀 High-Performance MT4 & MT5 Forex Trading Indicators
🛠️ Best Settings and Timeframes
Because hedge fund positioning data is not a tick-by-tick signal, it is usually more useful on higher timeframes. Day traders can still use it as a directional filter, but it is strongest for swing trading and position trading.
| Trading Style | Recommended Timeframe | How to Use the Indicator |
|---|---|---|
| Scalping | Not ideal alone | Use only as a broad directional filter. |
| Day Trading | H1 to H4 | Trade in the direction of institutional bias when intraday structure confirms. |
| Swing Trading | H4 to Daily | Best balance between timing and institutional context. |
| Position Trading | Daily to Weekly | Useful for larger trend following and sentiment extremes. |
✅ Hedge Fund Indicator Checklist
Before using any hedge fund indicator signal, run through this checklist. It can help you avoid weak trades and emotional entries.
- Is the market trending, ranging, or reversing?
- Does hedge fund positioning support the price direction?
- Is positioning at an extreme level?
- Is there divergence between price and institutional exposure?
- Is the entry located near a meaningful technical zone?
- Is there enough room to target before the next support or resistance?
- Is the risk-to-reward ratio acceptable?
- Is the setup clean enough to trade without emotional hesitation?
💡 Practical Trading Ideas
Here are several practical ways traders can integrate a hedge fund indicator into a forex strategy:
Idea 1: Follow the Fund Flow
When price trend and hedge fund positioning point in the same direction, look for pullback entries instead of countertrend trades.
Idea 2: Fade the Extreme
When positioning reaches an extreme and price fails to continue, watch for reversal setups near key technical levels.
Idea 3: Avoid Late Entries
If everyone is already long, the easy money may be gone. Wait for a correction or a fresh institutional build-up.
Idea 4: Confirm Technical Bias
Use positioning to support a bigger technical view based on trend structure, key levels, momentum, and volatility.
⚠️ Common Mistakes Traders Make
A hedge fund indicator can be powerful, but only when interpreted correctly. Many traders misuse it by treating every positioning change as an immediate trading signal.
- Entering too early: Positioning extremes can remain extreme for a long time.
- Ignoring price action: Institutional data is not enough without chart confirmation.
- Using it for scalping: Delayed positioning data is not designed for very short-term entries.
- Ignoring market structure: A currency trend may continue if higher highs, higher lows, and momentum remain intact.
- Trading without stops: Even hedge funds are wrong. Risk management is still essential.
🧩 Best Indicator Combinations
A hedge fund indicator becomes more useful when combined with tools that answer different questions. Positioning shows who may be involved. Technical tools show where price is reacting. Volatility tools help define risk.
| Combination | Purpose | Best For |
|---|---|---|
| Hedge Fund Indicator + Moving Average | Trend confirmation | Swing trading |
| Hedge Fund Indicator + RSI | Extreme sentiment and momentum reversal | Reversal setups |
| Hedge Fund Indicator + Support/Resistance | Better trade location | Day and swing trading |
| Hedge Fund Indicator + ATR | Stop loss and volatility planning | Risk management |
| Hedge Fund Indicator + Price Action | Entry confirmation and invalidation planning | Forex and gold trading |
📉 Example: How to Read a Bearish Signal
Imagine EUR/USD has been rising for several weeks. At the same time, a hedge fund indicator shows that leveraged funds are already heavily net long euro futures. Suddenly, EUR/USD fails to break a major resistance level and forms a lower high on the daily chart.
This does not mean traders should instantly sell. But it creates a warning: the long trade may be crowded. If price then breaks a key support zone, some institutional longs may begin to exit. That can create downside pressure as the market unwinds.
Bearish Setup Checklist
- Positioning is extremely net long.
- Price fails at resistance.
- Momentum weakens.
- Market structure breaks lower.
- Short entry appears after a retest or rejection.
📈 Example: How to Read a Bullish Signal
Now imagine GBP/USD has been falling for months. Hedge fund positioning shows large speculative traders are heavily short. But price stops making lower lows and begins to form a base around major support.
If price breaks above resistance while positioning remains extremely short, a short squeeze may occur. Traders who sold late may be forced to close positions, creating additional buying pressure.
Bullish Setup Checklist
- Positioning is extremely net short.
- Price holds major support.
- Bearish momentum fades.
- Resistance breaks with strong candle confirmation.
- Pullback holds above the breakout zone.
🧠 Pro Tips for Better Results
- Think in probabilities: Hedge fund data gives context, not certainty.
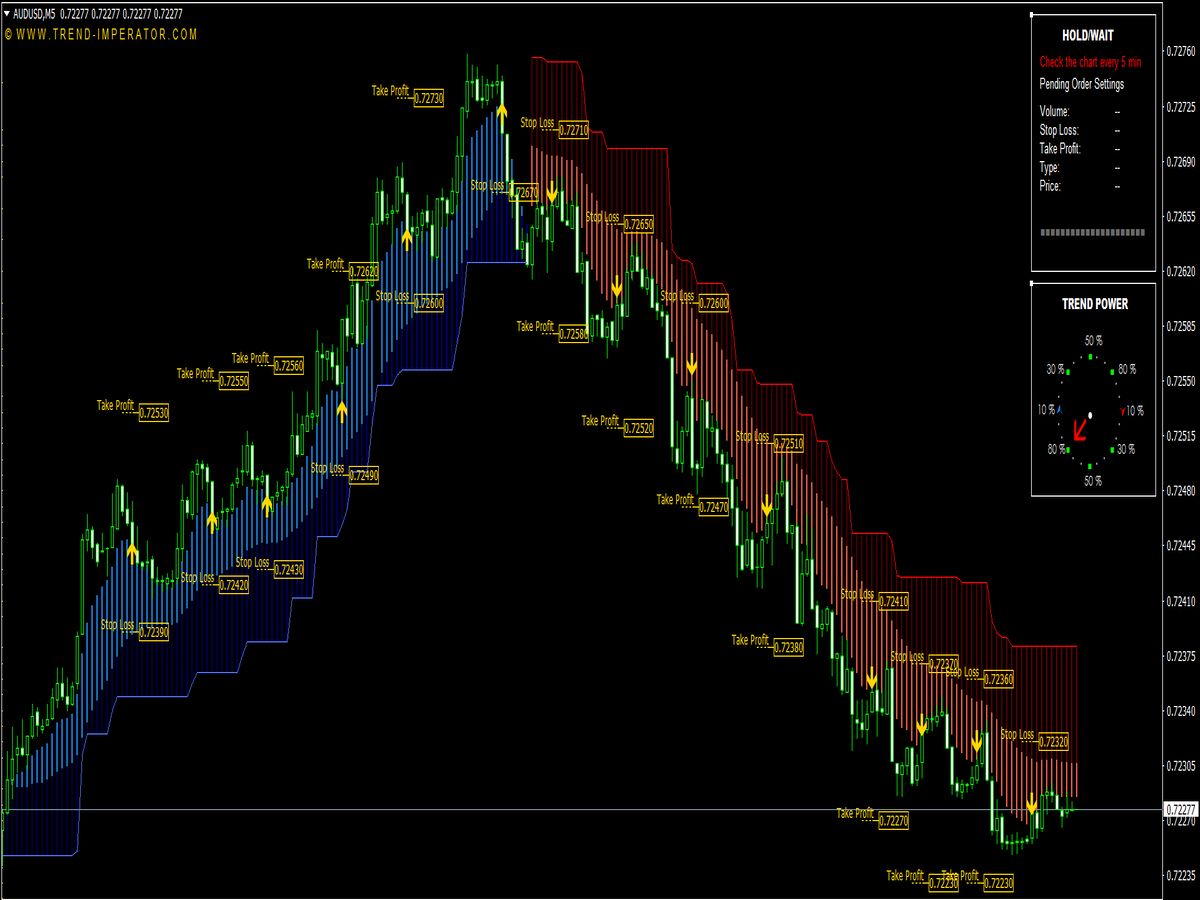
- Use higher timeframes: Daily and weekly charts match positioning data better than M5 charts.
- Watch changes, not only levels: A sharp weekly shift can matter more than the absolute number.
- Compare currencies: Strong bullish positioning in one currency and bearish positioning in another can support pair selection.
- Respect volatility: Sudden expansion candles can quickly change the quality of a setup, especially around support and resistance.
🎯 Precision Forex Trading Starts with Advanced Indicators
❓ Hedge Fund Indicator FAQs
Is a hedge fund indicator good for forex trading?
Yes, it can be useful for forex traders who want to understand positioning pressure, sentiment extremes, and trend quality. It is best used as a filter, not as a direct entry signal.
Can a hedge fund indicator predict the market?
No indicator can predict the market with certainty. Hedge fund positioning can highlight probabilities, extremes, and possible pressure points.
Is it better for scalping or swing trading?
It is usually better for swing trading and position trading because institutional positioning data is not designed for second-by-second trading decisions.
What is the best confirmation tool?
Price action is usually the best confirmation. Support, resistance, market structure, and breakout retests can help turn positioning context into a tradable setup.
Does extreme positioning always mean reversal?
No. Strong trends can stay crowded for a long time. Extreme positioning becomes more important when price starts to fail, reject, or break structure.
Can beginners use hedge fund indicators?
Yes, but beginners should first understand trend structure, risk management, and basic technical analysis before relying on institutional positioning data.
🏁 Final Thoughts: Should You Use a Hedge Fund Indicator?
A hedge fund indicator can be a valuable edge for forex traders who want to look beyond standard retail indicators. It helps reveal where large speculative traders may be positioned, when a trend has institutional support, and when a market may be too crowded on one side.
However, the best traders do not blindly follow hedge fund positioning. They combine it with price action, technical levels, MetaTrader confirmation, timing, stop loss placement, take profit planning, and disciplined risk management. Used correctly, a hedge fund indicator can help you trade with more context, more patience, and more professional decision-making.
In simple words: do not use it to chase signals. Use it to understand the battlefield before placing the trade.
Risk Disclaimer: Trading forex, CFDs, futures, indices, and gold involves significant risk. A hedge fund indicator, MetaTrader tool, or technical strategy can support analysis, but it cannot remove losses. Always use a defined stop loss, plan your take profit before entry, and risk only capital you can afford to lose.
📌 Great Indicators and Trading Systems for MT4 or MT5
- Top-Rated MetaTrader Indicators


- TRIX Slope Divergence MTF Indicator

- How Smart Traders Use the Fair…

- Can AI Trading Indicators…

- Divergence Solution Indicator

- Swing Trading Indicator Setups…

- Divergence Recognition…

- Profitable Forex Indicator:…

- RSI Slope Divergence Indicator

- Wildhog NRP Divergence Indicator

- Spielers Hedge Divergence Indicator

- Stochastic Divergence Indicator

- Mastering the SuperTrend…

- Volume Divergence with Arrows…

- Smoothed Divergence Indicator

- Why the Best Traders Watch…

- FXCX Divergence Indicator

- The Hidden MACD Indicator…

- T3 CCI Divergence V1 Indicator

- RSIMA Baseline Divergence…

- Divergence Candles Indicator

- Non-Repainting Non-Lagging Indicators