Break of Structure: The Trading Signal That Changes Everything

Break of Structure forex setup showing smart money trend reversal before explosive continuation
The move looks obvious after it happens. But where did the real shift begin?

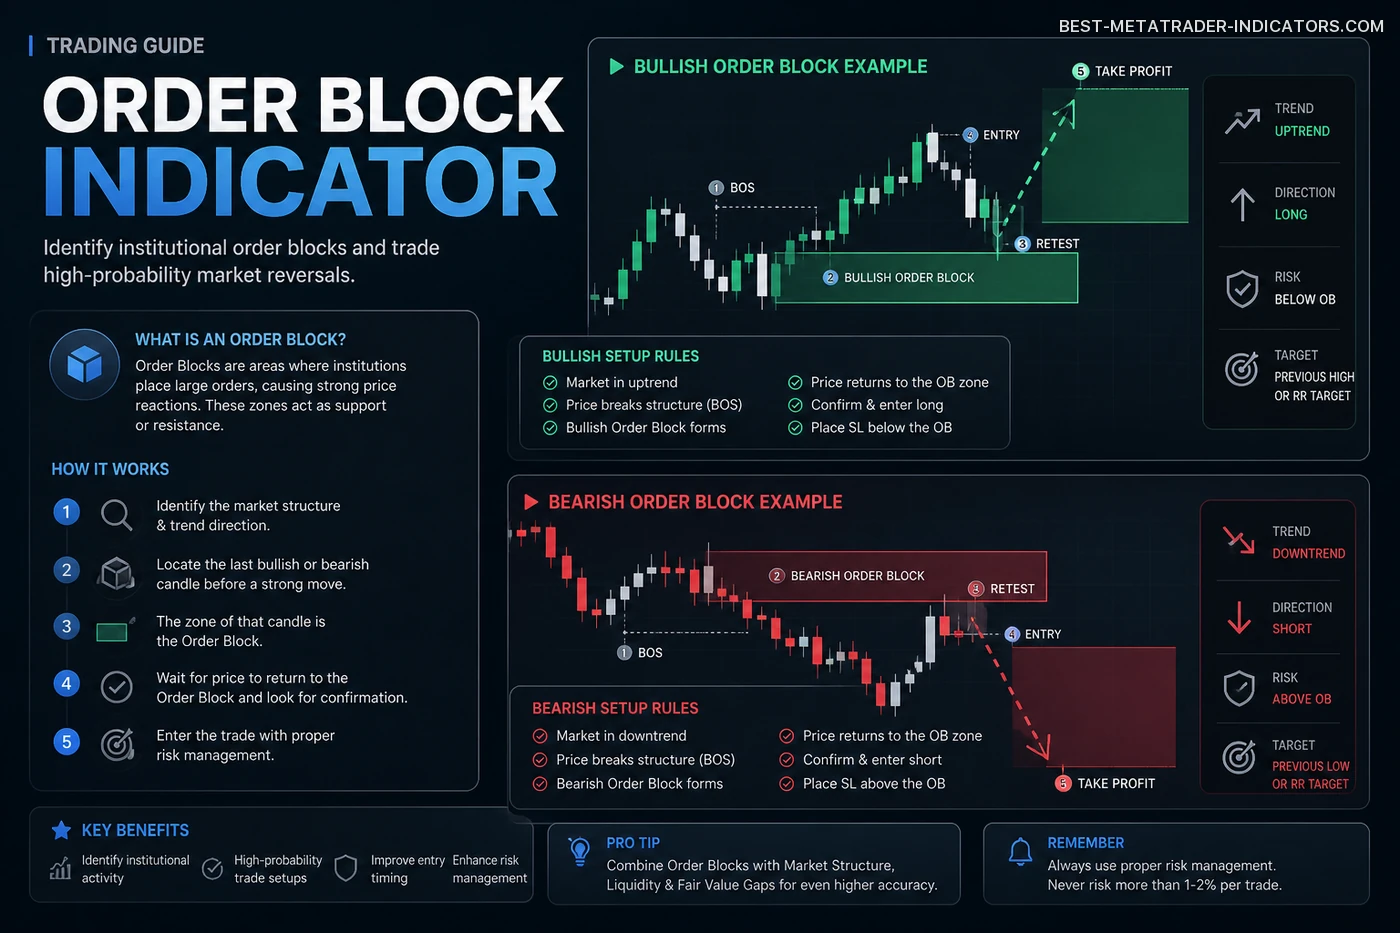
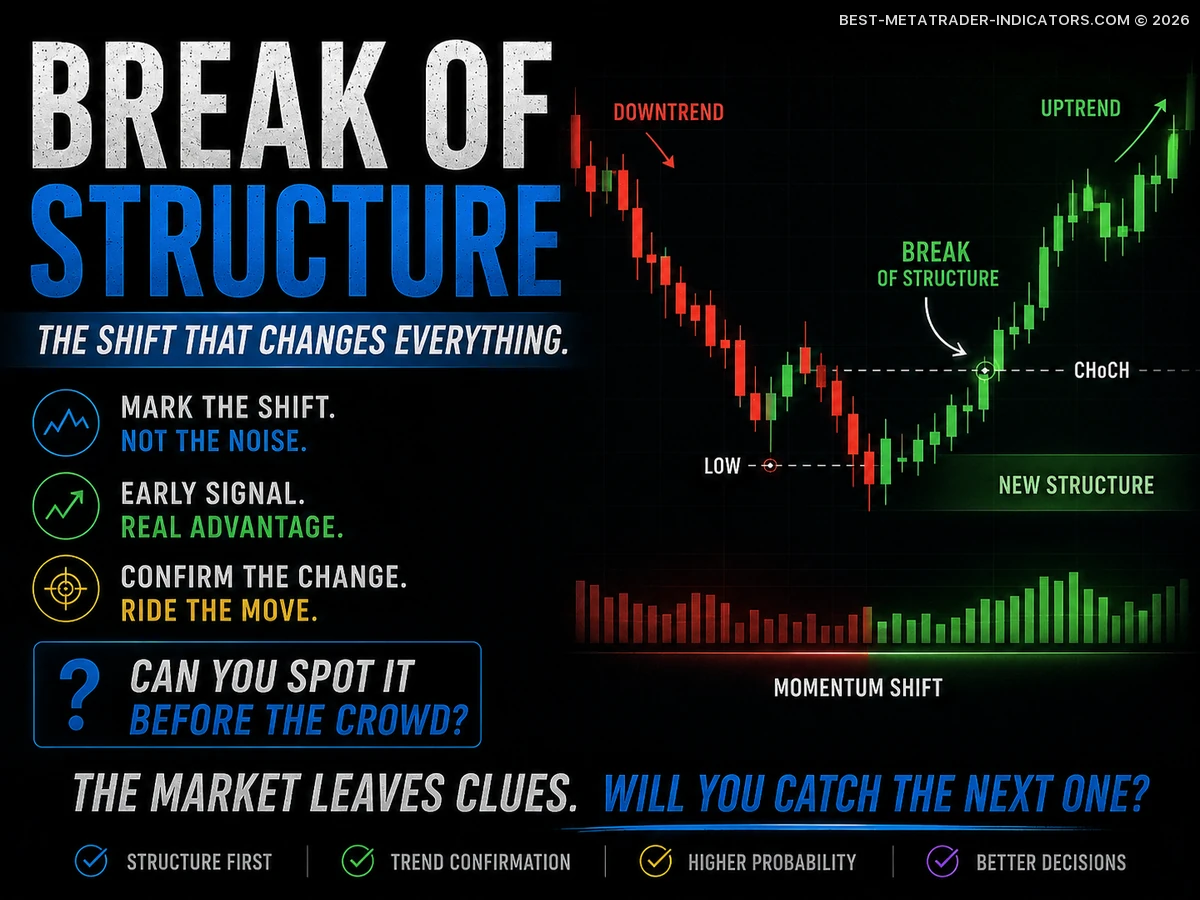
Break of Structure, often shortened to BOS, is one of the most practical concepts in technical analysis because it helps traders spot the moment price stops respecting its previous rhythm. In simple terms, a bullish BOS forms when price breaks above a previous structural high. A bearish BOS forms when price breaks below a previous structural low.

Yet the real value is not in the break alone. The edge comes from understanding where the break happens, what created it, and whether the move has real intent behind it. Many traders treat every broken high or low as a signal. Experienced traders slow down, read the context, and become far more selective.

Supply and Demand Indicator: The Zones Most Retail Traders Miss

Advanced Supply and Demand Indicator showing smart money entry zones and high-probability reversal setups
Hidden buying and selling zones could be shaping the next breakout right now.

A supply and demand indicator is built to identify price zones where strong buying or selling pressure previously entered the market. For Forex traders, these zones can become practical reference points for entries, exits, stop-loss placement, take-profit planning, and overall trade management.

Unlike a basic support and resistance indicator, a supply and demand tool focuses on areas where price moved away with force, often pointing to a clear imbalance between buyers and sellers. Used with judgment, it helps traders avoid random entries and build a more structured trading process around price action instead of impulse.

Order Block Indicator Secrets Every Trader Should Know

Order Block Indicator highlighting hidden institutional entry zones and smart money reversals on a forex trading chart
The chart already revealed the next move… almost nobody noticed it.

An order block indicator is a trading tool built to highlight price areas where larger market participants may have previously placed meaningful buy or sell orders. In Forex trading, these zones are often used to plan potential reaction areas, continuation entries, reversal setups, and cleaner risk-to-reward trades.

After more than two decades of watching currency charts move through calm sessions, fast expansions, failed breakouts, and brutal reversals, I can say this clearly: an order block is not magic. It is a map. The trader still has to read the terrain.

How Smart Traders Use the Fair Value Gap Indicator

Premium Fair Value Gap Indicator chart showing liquidity imbalance zones and precision entry opportunities
A tiny imbalance can trigger a massive move — if you know where to look first.

A Fair Value Gap indicator is a practical trading tool that highlights price imbalances directly on the chart. In Forex trading, these imbalances often appear when price moves with strong momentum and leaves behind an inefficient area where very little balanced two-sided trading took place.

Many professional traders use Fair Value Gaps, often called FVGs, to identify potential retracement zones, continuation setups, liquidity reactions, and high-probability entry areas. The edge is not in trading every gap blindly. The real work is in combining the indicator with market structure, trend direction, liquidity, session behavior, stop loss placement, take profit planning, and emotional discipline.

Liquidity Indicator: Find the Zones Where Big Traders Enter the Market

Institutional liquidity indicator revealing hidden forex pressure zones before major price expansion
The chart whispers before the market explodes.

A liquidity indicator is more than another chart overlay. It acts like a market-reading assistant, helping you understand where larger participants may be searching for orders before price commits to its real move.

In Forex trading, liquidity often rests above old highs, below old lows, around equal highs and lows, near session extremes, and close to obvious support and resistance areas. When price suddenly spikes into those areas and rejects, traders often call it a liquidity grab, stop hunt, or sweep.

This guide explains how liquidity indicators work, how traders use them, what signals deserve attention, and how to build smarter trading strategies around liquidity zones without blindly chasing every spike.

The Smart Money Indicator Strategy Professional Traders Quietly Use

Smart Money Indicator revealing buy-side and sell-side liquidity zones with real-time forex analysis
The chart wasn’t random. The liquidity target was there all along.

The smart money indicator is not a magic button, a guaranteed signal, or a shortcut to instant profits. In serious Forex trading, it works best as a structured way to identify where larger participants may be accumulating, distributing, trapping late entries, or repricing liquidity.

After more than two decades around currency charts, one lesson still holds: price does not simply wander around retail indicators. It moves toward liquidity, reacts around imbalance, and often punishes the most obvious positioning. A useful smart money indicator should make that logic easier to read without taking the decision out of your hands.

ICT Indicator Strategies Every Serious Trader Should Know

Institutional-grade ICT indicator visualizing order flow, BOS confirmations, and liquidity imbalances
Something unusual happens before every major breakout — this exposes it.

The ICT Indicator is built for traders who want to move beyond random signals and read the market through smart money concepts: liquidity, displacement, fair value gaps, order blocks, market structure shifts and premium-discount pricing. It is not a shortcut or a magic buy-and-sell button. Used correctly, it becomes a structured decision tool that helps you understand where price may hunt liquidity, where large players may reprice the market, and where cleaner trade setups can form.

From real chart work, the biggest advantage of an ICT-style indicator is not that it predicts the future. The advantage is that it forces you to slow down, mark key zones, wait for confirmation, and trade from areas where risk can be defined clearly before the order is placed.

Volume Profile Indicator Trading Guide for Forex and Gold

Forex Volume Profile setup highlighting hidden liquidity zones and institutional trading activity
The market leaves footprints — but only a few traders know where to look

The Volume Profile Indicator is one of the most useful tools a Forex trader can bring to a chart when the goal is to understand where real trading interest has built up. A standard volume indicator shows activity across time. Volume Profile shows activity at price. That difference changes the way you read a market.

After more than two decades of watching currency pairs move through quiet ranges, aggressive breakouts, failed retests, and messy reversals, I have learned that price alone rarely tells the whole story. A candle tells you where price opened, closed, and travelled. Volume Profile helps you judge where the market accepted price, where liquidity collected, and where price may react again when it comes back.