The Exit Strategy That Separates Disciplined Forex Traders from Emotional Ones

Stop Loss and Take Profit trading chart showing hidden exit zones, price action structure, and smart money trade management
Most traders master entries. Professionals focus on where the trade should really end.

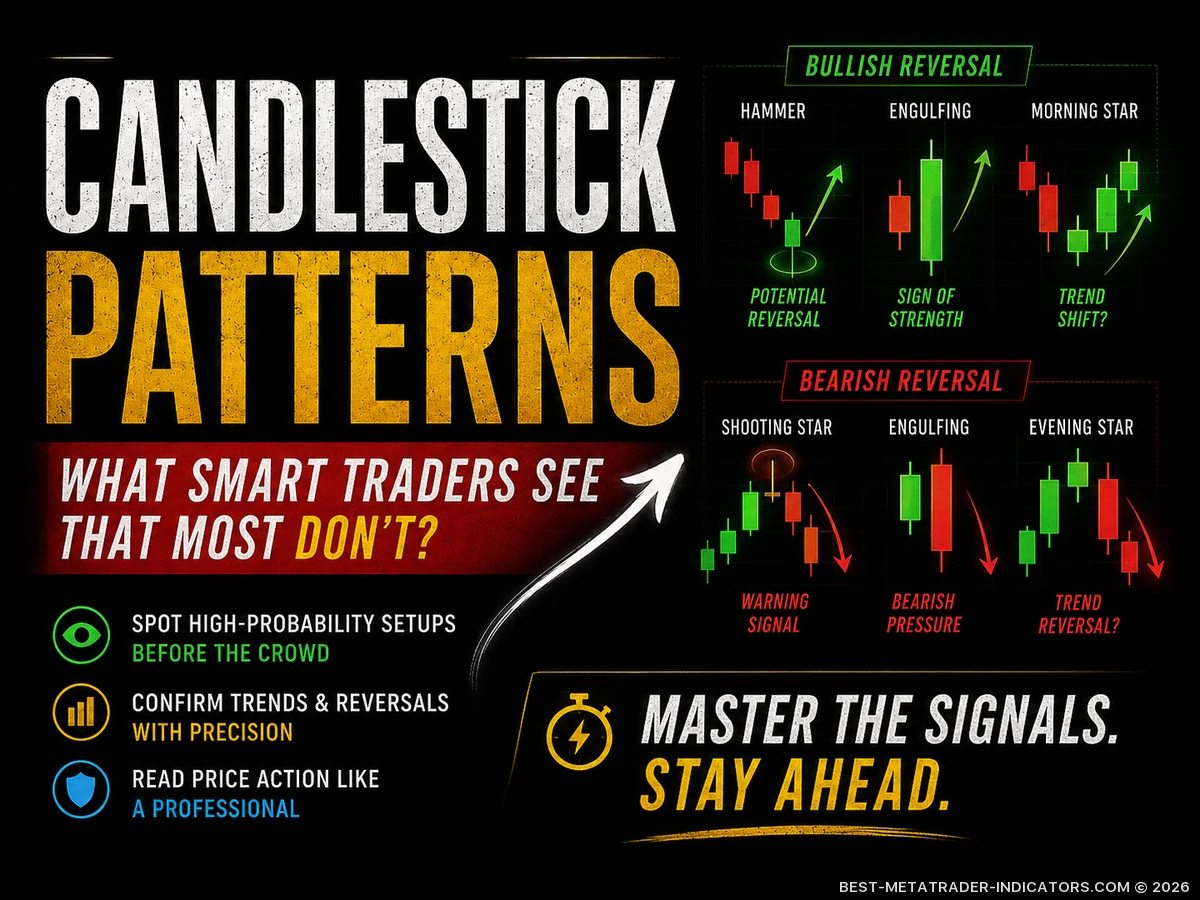
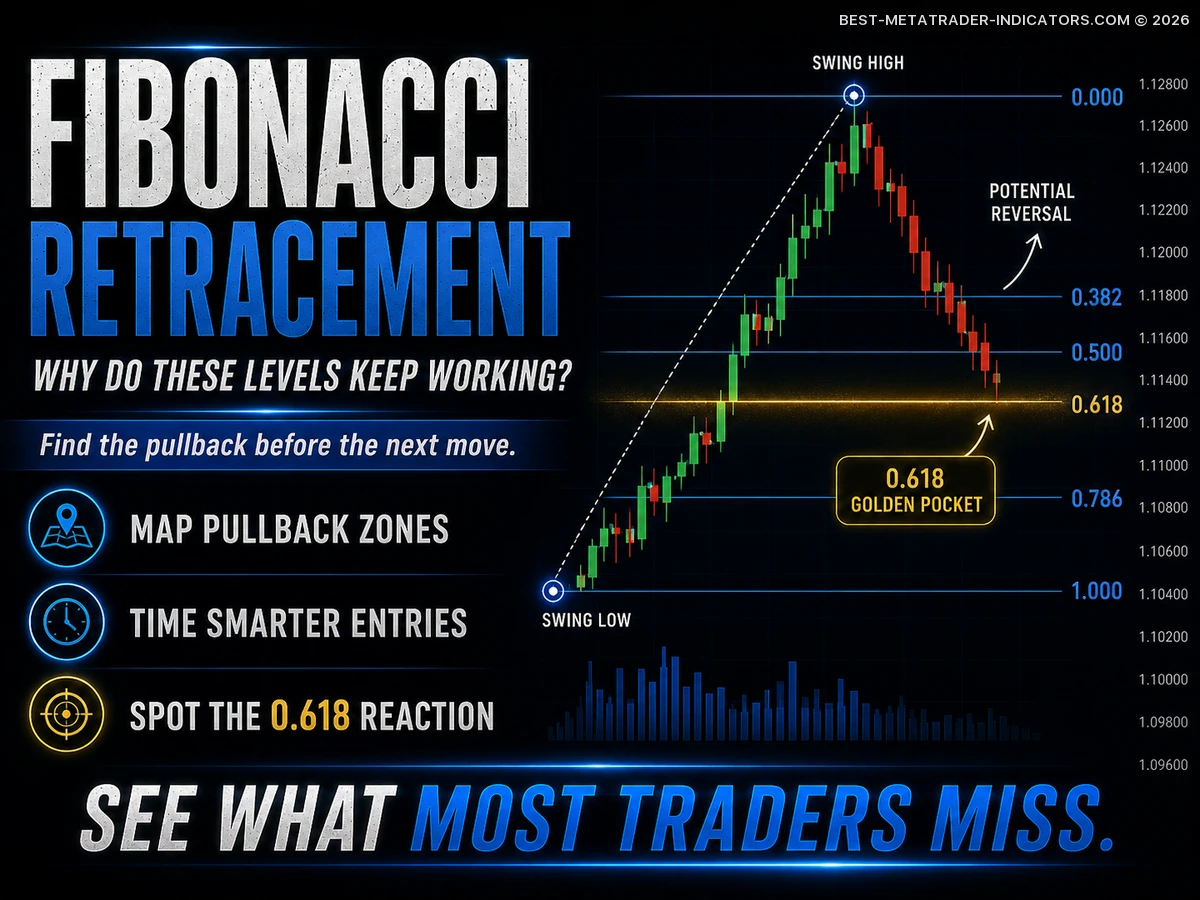
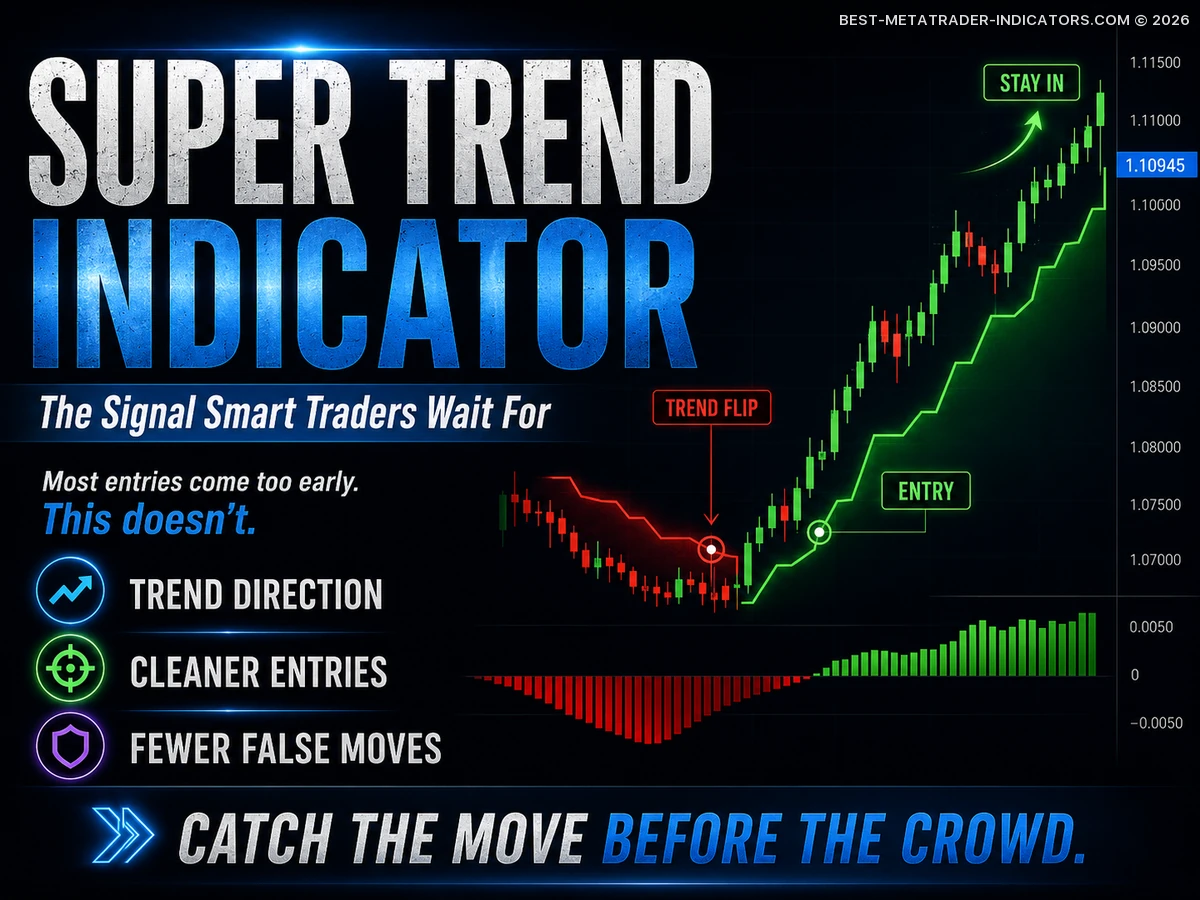
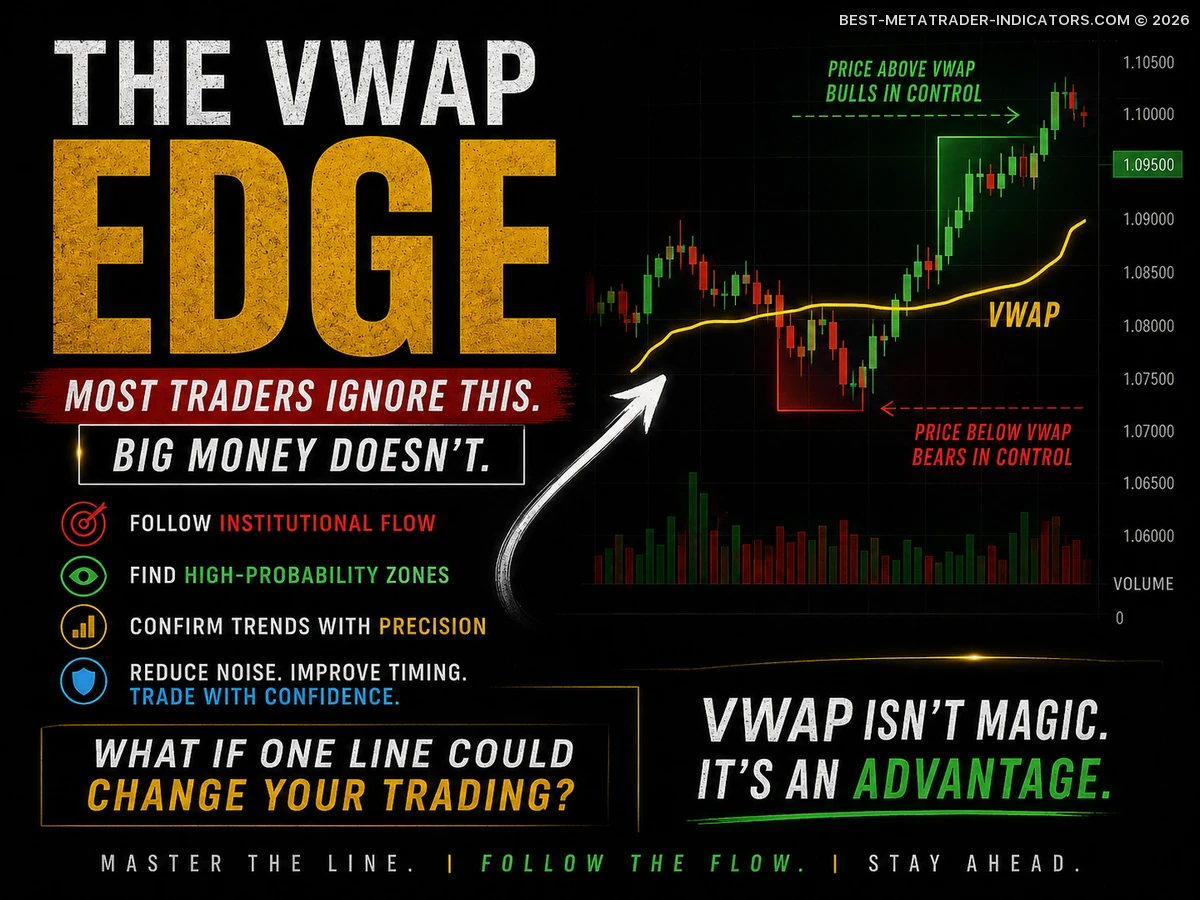
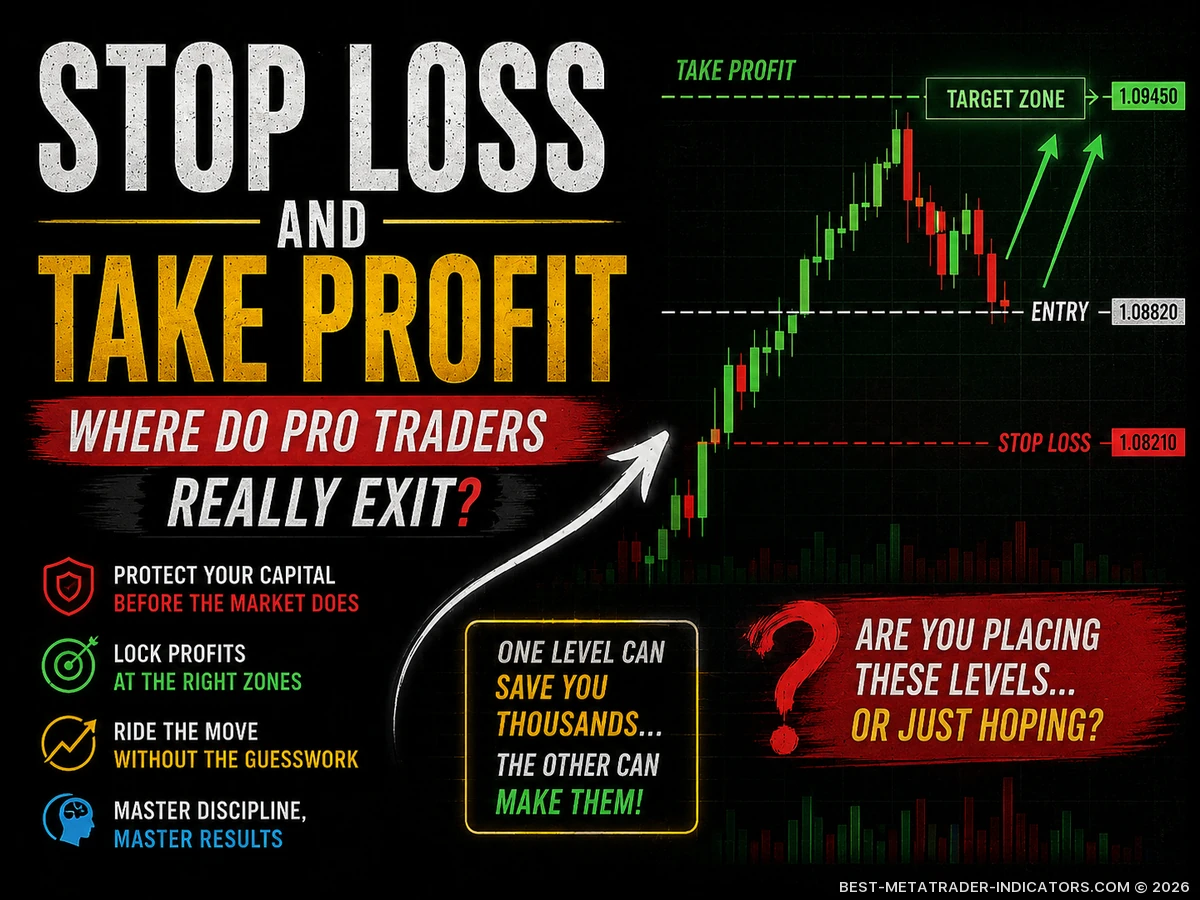
Every Forex trader likes talking about entries. The clean breakout. The patient pullback. The sharp entry after a liquidity sweep. After enough time in live markets, though, one lesson becomes hard to ignore: your entry gets you into the trade, but your exit decides whether you survive long enough to become good.

A Stop Loss and Take Profit plan is where strategy becomes discipline. It turns hope into structure, emotion into rules, and random risk into measurable decision-making. Below, we work through how serious traders think about Stop Loss and Take Profit levels, how they place them, how they avoid common exit mistakes, and how a repeatable Forex exit framework can be built without overcomplicating the trade.

How Candlestick Patterns Reveal Market Reversals Before Most Traders Notice Them

Premium “Candlestick Patterns” cover image with bullish and bearish reversal charts teasing hidden market signals traders often miss
The market left clues before the reversal — most traders never saw them.

Candlestick patterns are one of the most useful visual tools in Forex trading because they compress market psychology into a single candle or a small group of candles. A wick shows rejection. A body shows commitment. A close shows who won the battle for that session. When you learn to read these details in context, price action starts to look less random and more like a sequence of decisions made under pressure.

But here is the truth many beginners miss: a candlestick pattern alone is not a complete trading strategy. A bullish engulfing candle in the middle of nowhere is just a candle. The same candle at a higher-timeframe support zone, after a liquidity sweep, with improving momentum and a clean risk-to-reward profile can become a trade idea worth planning.

How to Use Fibonacci Retracement Without Guessing the Next Move

Forex chart with Fibonacci Retracement levels, highlighted pullback area, and potential reversal signal
Most traders see the pullback. Few notice the level that matters.

Fibonacci retracement is one of those tools that looks simple on the chart but only becomes useful when it is handled with discipline. Many traders draw the levels, wait for price to touch 38.2%, 50%, or 61.8%, and enter almost automatically. That is not analysis. That is guessing with clean-looking lines.

Used properly, Fibonacci retracement is not a prediction tool and not a shortcut to certainty. It is a structured way to judge where a trend may pause, pull back, and possibly continue. In Forex, where price usually moves through impulses, corrections, sweeps, and continuation legs rather than straight lines, this framework can help with entries, stop-loss placement, partial profits, and realistic trade management.

Mastering the SuperTrend Indicator for Smarter Forex Trade Entries

SuperTrend Indicator highlighting trend confirmation and reversal zones in Forex trading
What are experienced traders spotting in the SuperTrend before the market moves?

The SuperTrend indicator is popular for one simple reason: it turns market direction into a clean visual signal. In Forex, where noise, false breaks, emotional entries, and over-analysis can quickly distort judgement, SuperTrend gives traders a straightforward framework: trade with the dominant move, respect the line, and avoid forcing positions when price action is unclear.

There is also a professional truth that matters: SuperTrend is not a mechanical buy-and-sell machine. It works best when the trader understands market structure, volatility, session rhythm, risk placement, and confirmation. Used with context, it can become a useful part of a trading plan. Used blindly, it can produce late entries, avoidable whipsaws, and uncomfortable drawdowns.

How Ichimoku Kinko Hyo Helps Forex Traders Spot High-Probability Market Moves

Professional Ichimoku Kinko Hyo trading chart revealing hidden trend direction, momentum strength and cloud-based breakout signals
Most traders see candles. Professionals see what forms inside the cloud first.

🌥️ Why Ichimoku Still Matters in Forex

Ichimoku Kinko Hyo is one of the few technical analysis systems that can give a trader a complete market view in one chart. Instead of asking only “is price going up or down?”, Ichimoku asks a better question: is the market in balance, trending, or becoming vulnerable?

The name is often translated as “one glance equilibrium chart”. That is exactly the point. A good Ichimoku setup should let you assess the trend, momentum, key support and resistance zones, and the quality of a possible trade without adding five different indicators on top of each other.

In Forex, where price can move from quiet Asian-session ranges to aggressive active-session breakouts, Ichimoku is valuable because it gives structure. It helps you avoid random entries, late trend chasing, and trades taken directly into hidden resistance.

Many beginners see Ichimoku for the first time and think it looks complicated. Five lines, a cloud, forward-shifted levels, and one line pushed into the past can feel overwhelming. But once you understand the role of each component, the system becomes surprisingly logical. This article breaks it down in a practical, trader-friendly way.

Why VWAP Has Become Essential for Modern Forex Traders

Institutional VWAP trading concept showing the line smart money follows while retail traders stay confused
Most traders react to price. Professionals react to VWAP first.

VWAP, or Volume Weighted Average Price, is more than another line added to a trading chart. Used with discipline, it becomes a practical benchmark for fair value, execution quality, trend bias, and intraday trade location. In Forex, where traders usually work with tick volume rather than centralized exchange volume, VWAP still has real value when it is applied with realistic expectations and a structured trading process.

This article explains VWAP from a trader’s point of view: what it measures, how it behaves during active sessions, where it helps, where it misleads, and how to build practical Forex strategies around it without treating it like a guaranteed signal.

Moving Average Secrets That Can Completely Change the Way You Trade Forex

Professional Forex chart with moving average analysis for identifying trend continuation opportunities
What makes moving averages so powerful in fast-moving Forex markets?

Moving Average (MA) is one of the most widely used indicators in Forex trading because it turns noisy price action into a cleaner visual story. It does not predict the future, and it does not magically know where EUR/USD, GBP/JPY or XAU/USD will go next. What it does extremely well is help traders answer three practical questions: Is the market trending? Where is the average value area? And is momentum shifting?

After more than two decades of watching traders overcomplicate simple ideas, one lesson stands out: the moving average is powerful only when it is used with context. Used alone, it can be late, noisy or misleading. Used with structure, risk management, price action and market regime, it becomes a reliable decision filter.

Inside the Stochastic Oscillator Strategies Professional Forex Traders Trust Most

Premium Stochastic Oscillator trading graphic showing hidden momentum shifts and overbought reversal zones in Forex markets
The indicator everyone knows… but almost nobody reads correctly.

The Stochastic Oscillator looks simple on the surface, but it rewards traders who read the story behind the signal. Many beginners treat it as a basic overbought or oversold gauge. Experienced Forex traders tend to use it with more nuance: as a momentum lens, an entry-timing filter, a divergence tool, and a warning that a move may already have spent most of its usable energy.

This guide explains how Stochastic works, how to read it in live Forex conditions, which strategies are actually practical, where traders usually get trapped, and how to build a checklist before putting capital at risk.