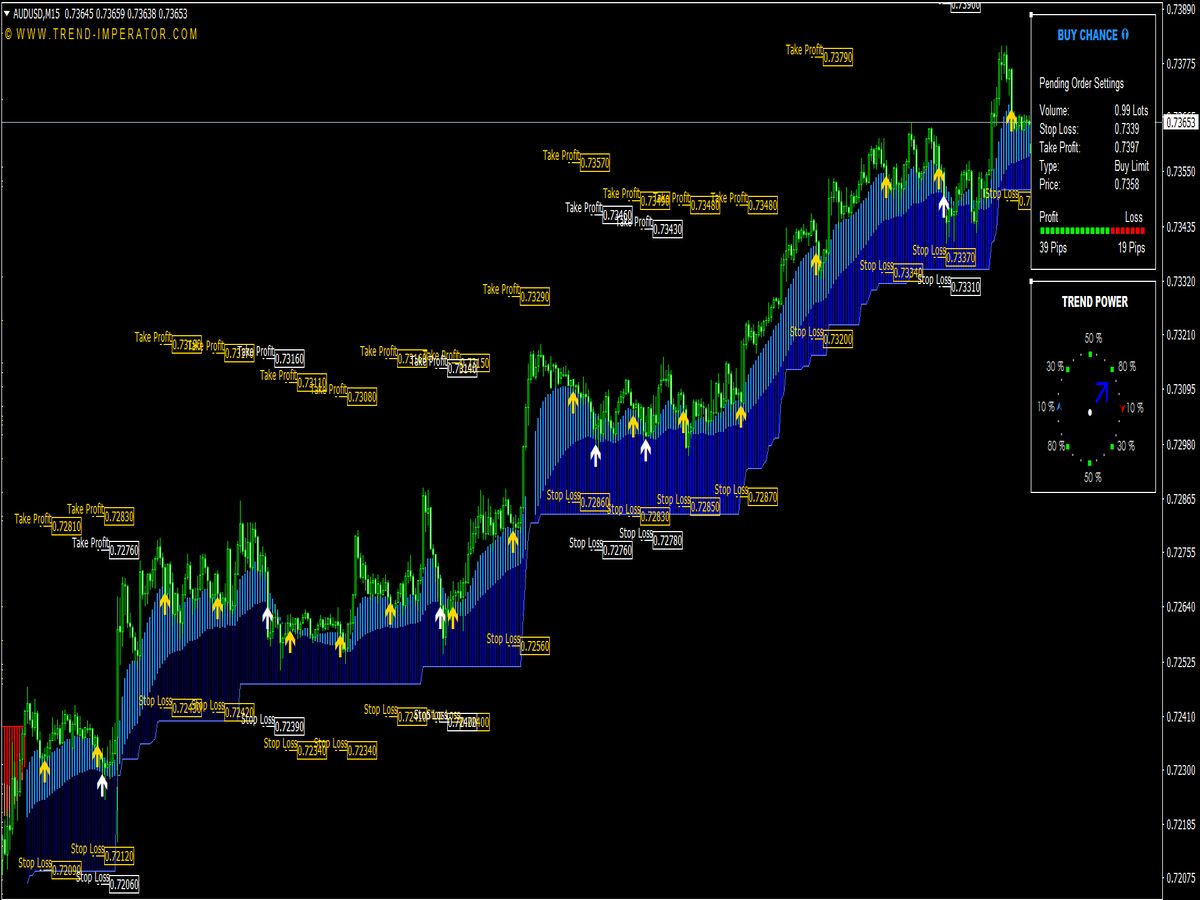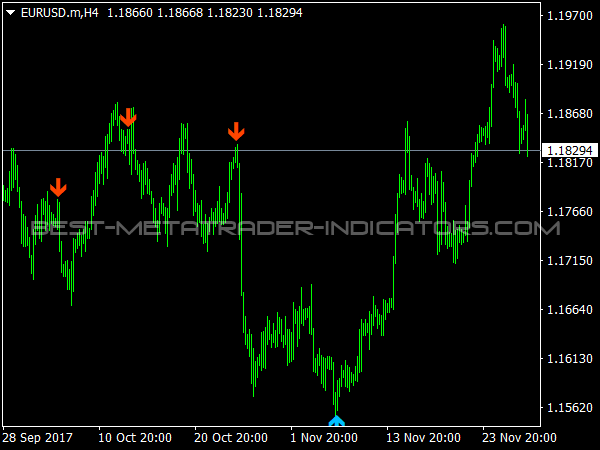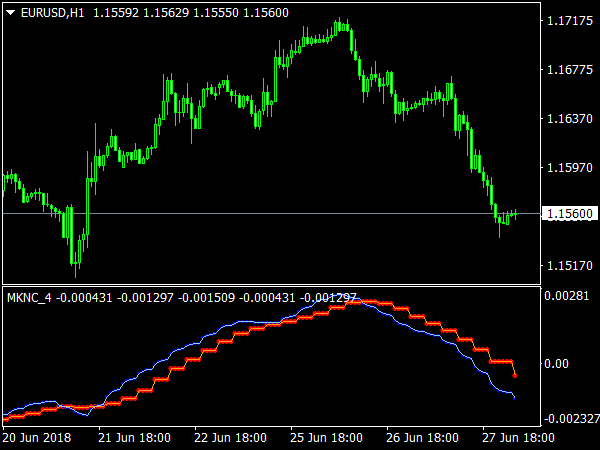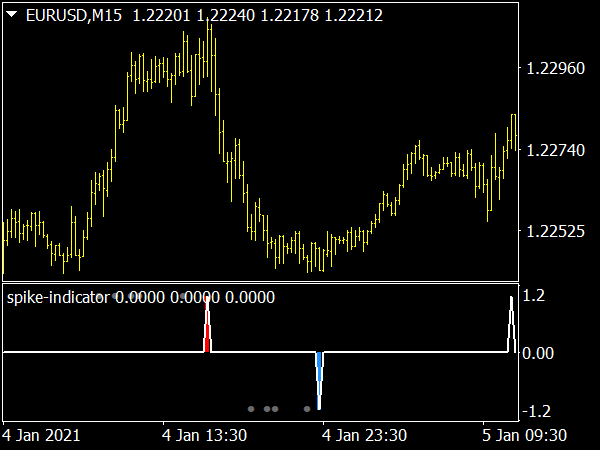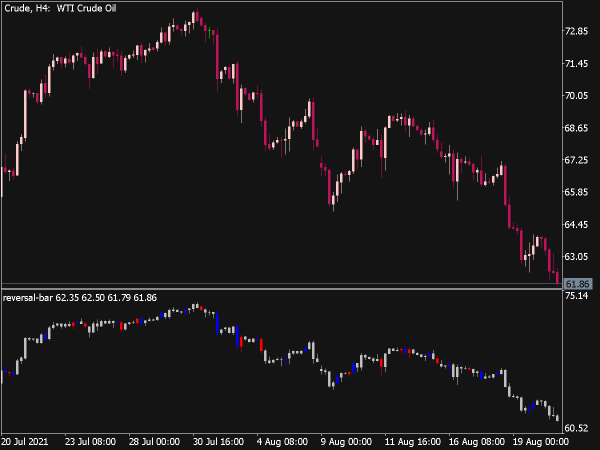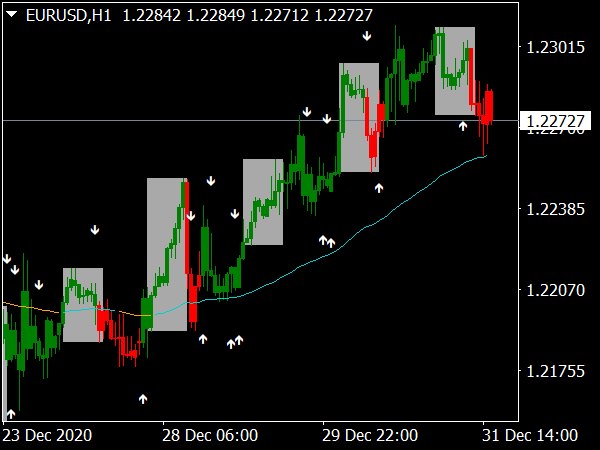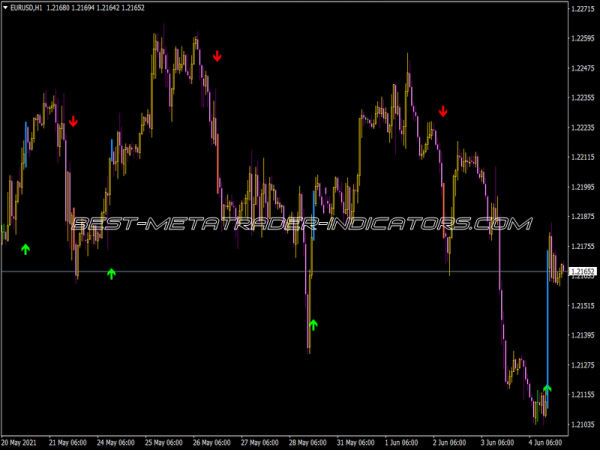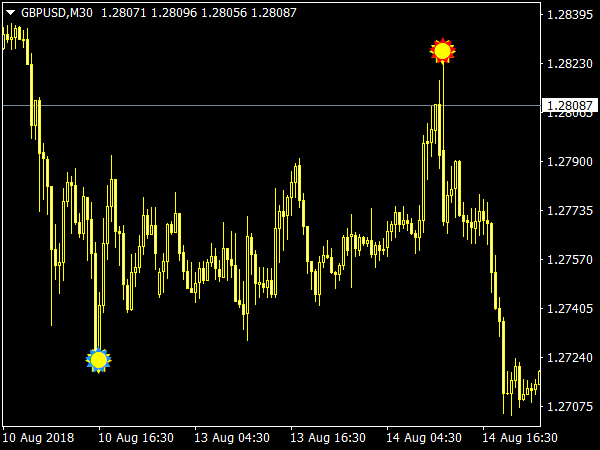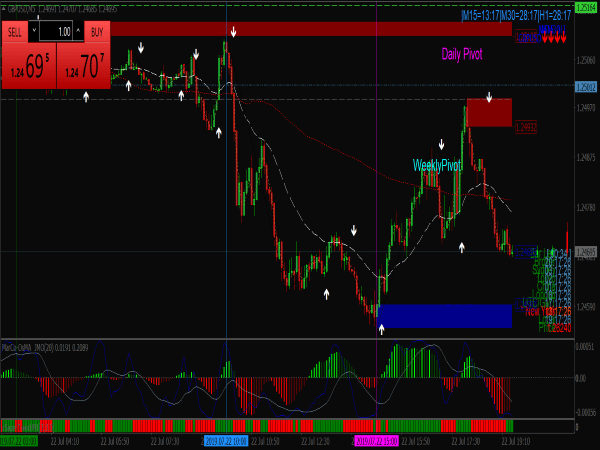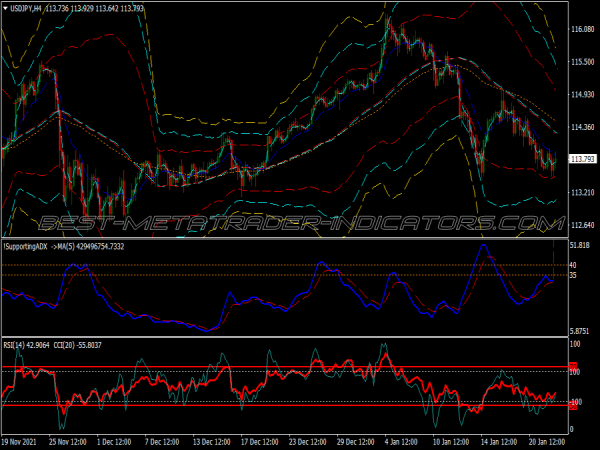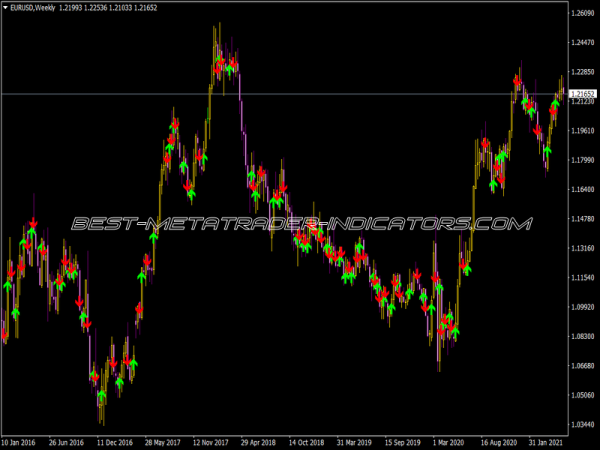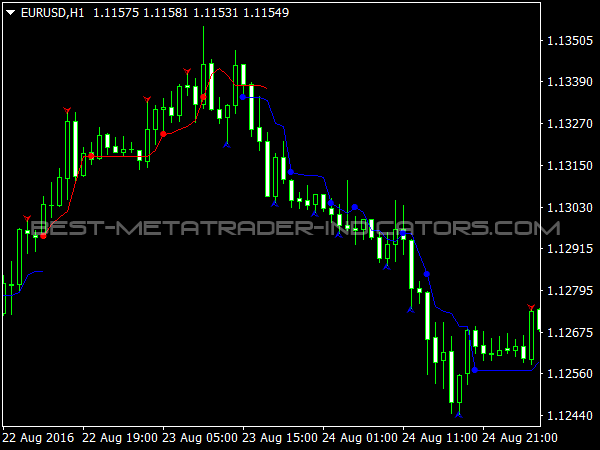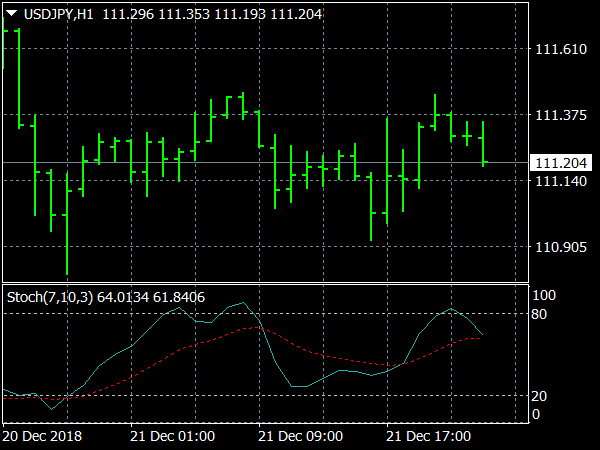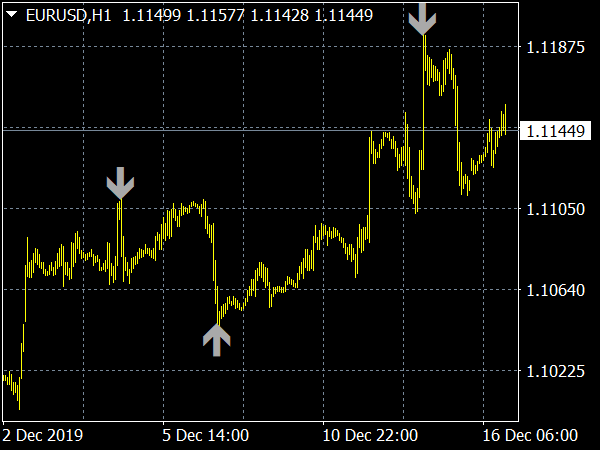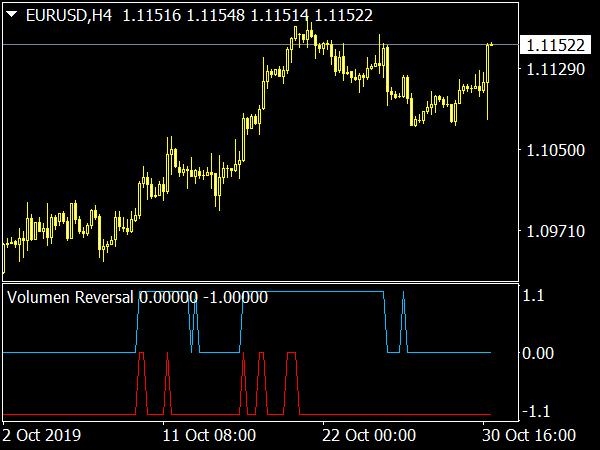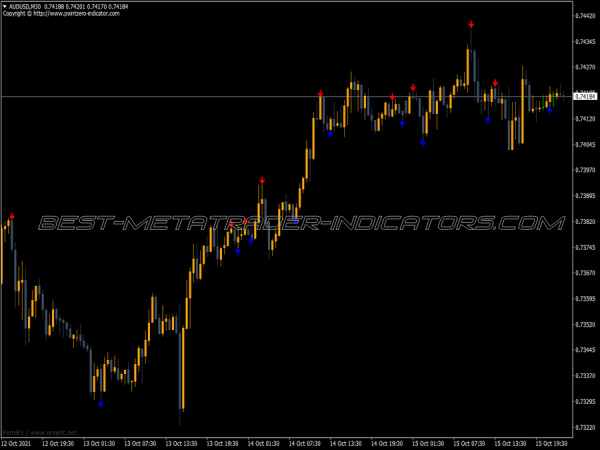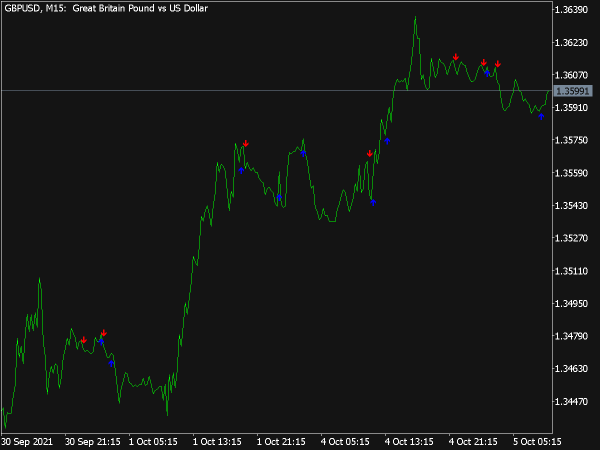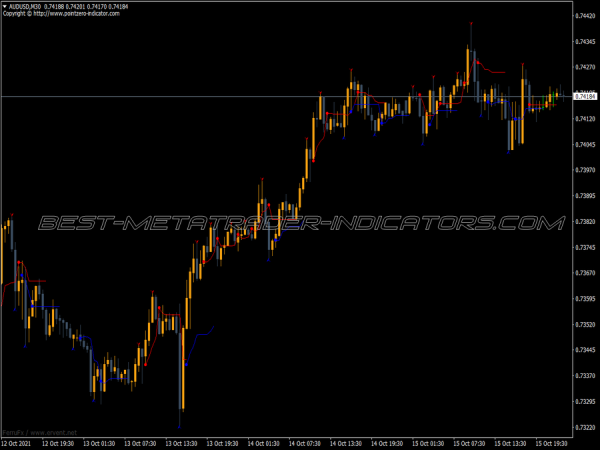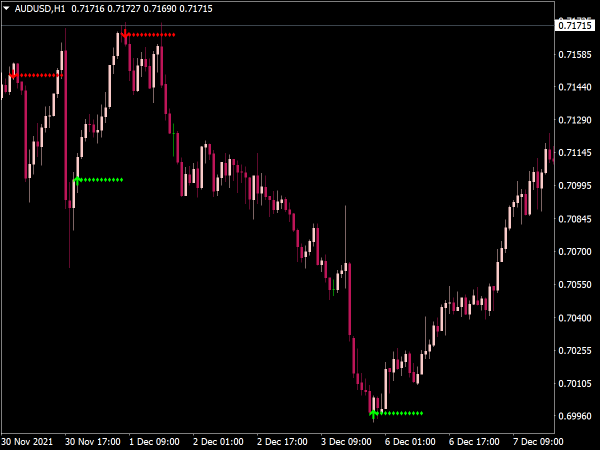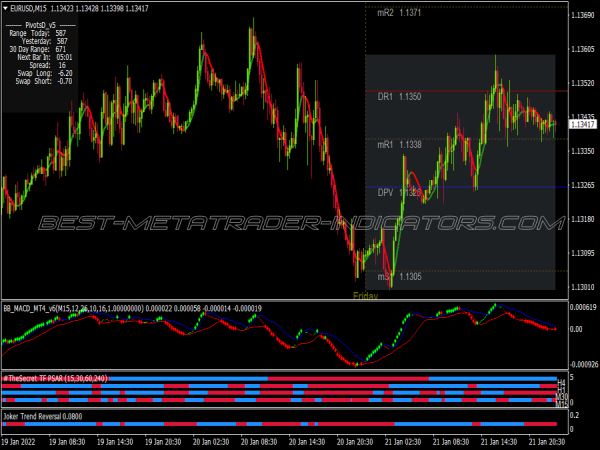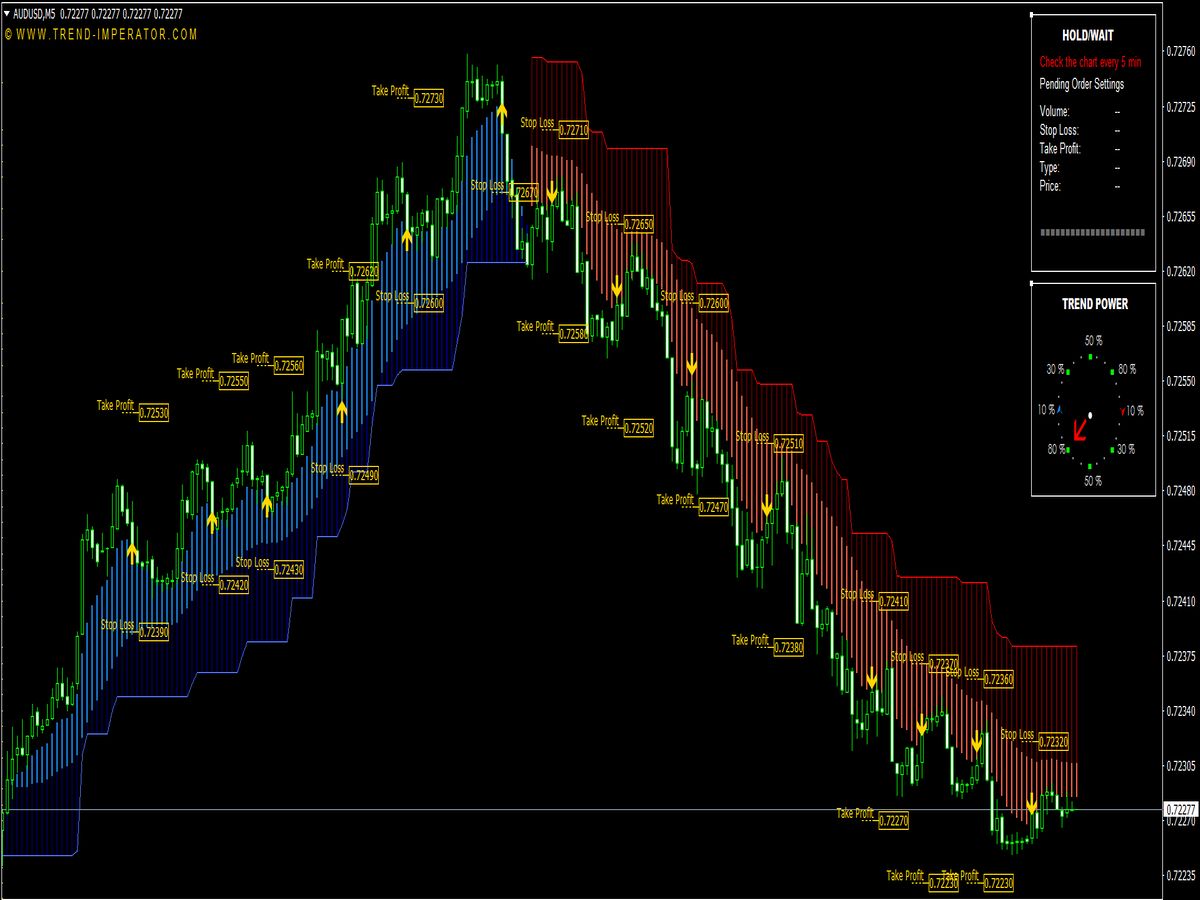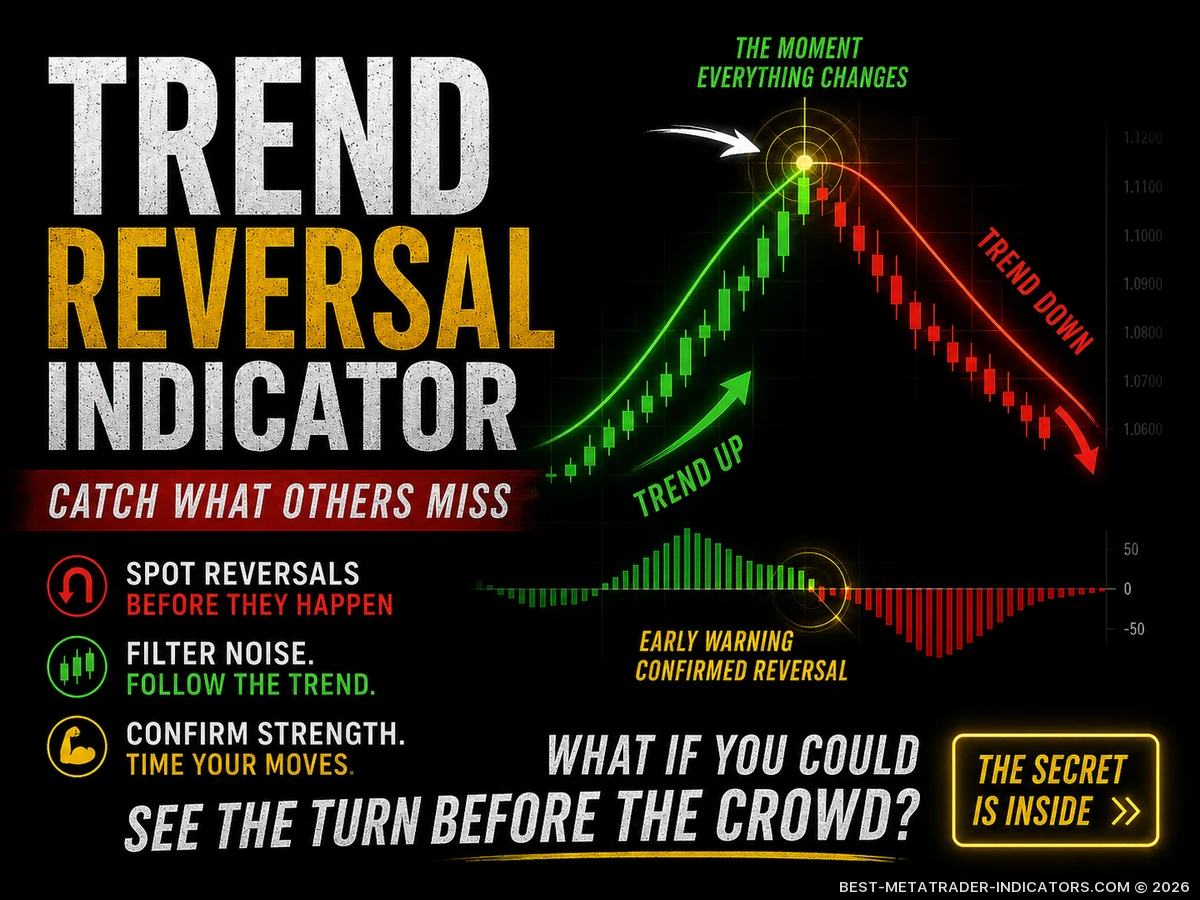
A Trend Reversal Indicator helps traders identify the moments when an existing trend may be losing strength and a new directional move could be starting to form. In Forex trading, that can be extremely useful — but also dangerous when the signal is read without context. A reversal signal by itself is not a trade. It is a warning that market structure, momentum, liquidity, or volatility may be changing.
After more than two decades of watching charts, one lesson becomes very clear: most traders do not lose because they miss reversals. They lose because they enter too early, ignore the higher timeframe, or mistake a normal pullback for a genuine trend change.
📌 What Is a Trend Reversal Indicator?
A Trend Reversal Indicator is a technical analysis tool designed to highlight potential turning points in the market. It may use moving averages, momentum shifts, volatility changes, divergence, candle patterns, support and resistance, or a combination of several signals.
The goal is simple: detect when buying pressure is starting to replace selling pressure, or when selling pressure is beginning to dominate after an uptrend. Still, experienced traders never treat reversal indicators as magic prediction tools. They use them as part of a wider decision process.
🧠 Professional Note
A reversal indicator should answer one practical question: Is the current trend weakening enough to justify looking for the opposite side? It should not automatically decide your entry, stop loss, or position size.
🔍 How Trend Reversal Indicators Usually Work
Most reversal tools try to measure a shift in market behavior. Some focus on momentum, others focus on price structure, and some combine several conditions into one signal. The most useful indicators are usually not the ones that flash the most arrows, but the ones that filter out weak and noisy signals.
📉 Momentum Shift
Momentum-based indicators look for a loss of strength in the current move. Examples include RSI divergence, MACD shifts, stochastic turns, or custom oscillator signals.
🏗️ Structure Break
Structure-based reversal tools wait for price to break a previous high or low. This can help traders avoid stepping in against a strong trend before the chart has actually changed character.
💧 Liquidity Sweep
Some advanced reversal concepts focus on stop hunts, failed breakouts, and liquidity grabs near obvious highs or lows before the real move begins.
⚙️ Common Types of Trend Reversal Indicators
There are many ways to identify possible reversals. The right choice depends on your trading style, timeframe, and tolerance for false signals.
| Indicator Type | What It Shows | Best Use Case |
|---|---|---|
| Moving Average Crossover | A possible shift in trend direction | Swing trading and trend-following reversals |
| RSI Divergence | Momentum disagreement with price | Spotting exhaustion near support or resistance |
| MACD Reversal | Momentum transition and trend weakening | Confirming early directional changes |
| Supertrend Flip | Volatility-based direction change | Cleaner trend reversal confirmation |
| Custom Arrow Indicator | Predefined reversal signal conditions | Fast chart scanning, especially on MT4 or MT5 |
🎯 Best Strategy: Reversal Indicator + Market Structure
The strongest reversal setups usually appear when an indicator signal forms at an important market level. A buy arrow in the middle of nowhere is weak. A buy signal after a liquidity sweep below support, followed by a break of structure, carries far more weight.
✅ Example Bullish Reversal Setup
- Price is in a clear downtrend.
- Price sweeps below a previous swing low.
- The Trend Reversal Indicator prints a bullish signal.
- RSI or MACD shows momentum improvement.
- Price breaks a minor lower high.
- Entry is taken on a pullback, not through emotional chasing.
📈 Bullish Reversal Trading Plan
A bullish reversal does not mean you should buy immediately. It means the previous selling pressure may be weakening. The safer approach is to wait for confirmation instead of trying to catch the lowest tick.
🟢 Bullish Reversal Checklist
- Is price near a higher timeframe support zone?
- Has price made a false break or liquidity sweep?
- Is the reversal signal aligned with momentum?
- Did price break a lower high?
- Can the stop loss be placed below a logical swing low?
- Is the potential reward at least two times the risk?
📉 Bearish Reversal Trading Plan
A bearish reversal setup becomes more attractive when price fails at resistance, sweeps liquidity above a recent high, and then shifts structure to the downside. Many losing traders short too early simply because price looks expensive. Professional traders wait for evidence.
🔴 Bearish Reversal Checklist
- Is price approaching a major resistance or supply area?
- Did price create a false breakout above a previous high?
- Is bullish momentum fading?
- Has price broken a minor higher low?
- Is there enough space before the next support zone?
- Does the setup still make sense after spreads and volatility?
🧩 Trend Reversal Indicator vs Trend Following Indicator
Many traders mix up reversal indicators and trend-following indicators. They are related, but they do not solve the same problem. A reversal indicator tries to catch the turn early. A trend-following indicator tries to keep you in the confirmed move.
Reversal vs Trend Following
The difference is not only technical. It changes your psychology, entry timing, risk profile, and trade management.
| Feature | Trend Reversal Indicator | Trend Following Indicator |
|---|---|---|
| Main GoalWhat it tries to detect | Early turning points | Continuation of an established trend |
| Signal TimingWhen it reacts | Earlier, but with more false signals | Later, but usually with more confirmation |
| Best MarketWhere it works better | Exhaustion zones, support, resistance | Clean directional trends |
| Main RiskCommon mistake | Entering against a strong trend too soon | Entering after the move is already extended |
🛠️ MetaTrader Tips for MT4 and MT5 Traders
Many Trend Reversal Indicators are built for MetaTrader 4 and MetaTrader 5. Some use arrows, alerts, buffers, dashboards, or multi-timeframe filters. Before using any indicator live, test it across different market conditions: trending, ranging, high volatility, low volatility, and fast-moving sessions.
🔔 Use Alerts Carefully
Push alerts are useful, but they can also create impulsive trading. Treat every alert as a reason to check the chart, not as a command to enter.
⏱️ Check Higher Timeframes
A reversal signal on M15 becomes more reliable when H1 or H4 also shows exhaustion, a structure change, or a major technical level nearby.
⚠️ The Biggest Mistakes Traders Make
Reversal trading is attractive because it offers early entries and large reward potential. But that attraction is also the trap. The market can stay extended, one-sided, or painfully persistent longer than most traders can stay disciplined.
🚫 Avoid These Reversal Traps
- Buying only because price has dropped a lot.
- Selling only because price has risen sharply.
- Ignoring the higher timeframe trend.
- Entering before a structure break.
- Moving the stop loss because the reversal “should” happen.
- Taking every arrow signal without filtering weak zones.
💰 Risk Management for Reversal Trades
Risk management is more important with reversal trading than with many other styles, because early reversal entries naturally carry a higher chance of being wrong. Your stop loss should be placed where the reversal idea is invalidated, not where it feels comfortable.
| Risk Element | Practical Rule |
|---|---|
| Stop Loss | Place it beyond the swing high or swing low that invalidates the reversal idea. |
| Take Profit | Target the next logical liquidity zone, support, resistance, or previous structure point. |
| Position Size | Keep risk small enough that one false signal does not affect your next decision. |
| Trade Frequency | Fewer filtered reversal trades are usually better than many random signals. |
🧠 Psychology: Why Reversal Trading Feels So Tempting
Reversal trading appeals to the ego. It feels good to buy the bottom or sell the top. But professional trading is not about looking clever. It is about taking repeatable trades with controlled risk.
The best reversal traders are patient. They do not need to catch the exact top or bottom. They prefer entering after the market gives evidence that the previous side is losing control.
📓 Trader’s Rule
Do not ask, “Is this the top?” Ask, “What would prove that buyers or sellers have actually lost control?” That small shift can prevent many emotional trades.
📋 Simple Reversal Trading Checklist
Before entering a reversal trade, go through this quick checklist. If too many answers are unclear, skip the trade.
- Trend direction is clear before the reversal attempt.
- Price is reacting from a meaningful support, resistance, supply, or demand zone.
- The Trend Reversal Indicator signal appears near that zone.
- Momentum supports the reversal idea.
- Market structure confirms the shift.
- The stop loss has a logical technical location.
- The reward potential is worth the risk.
- No high-volatility technical event is likely to distort execution.
❓ Trend Reversal Indicator FAQ
Can a Trend Reversal Indicator predict the market?
No indicator can predict the market with certainty. A reversal indicator only highlights conditions where a trend may be weakening or changing.
What is the best timeframe for reversal signals?
Higher timeframes such as H1, H4, and Daily usually produce cleaner reversal signals, while lower timeframes create more noise and more false alerts.
Should I trade every reversal arrow?
No. Arrow signals should be filtered with market structure, support and resistance, momentum, volatility, and risk-to-reward conditions.
Is divergence useful for trend reversals?
Yes, divergence can be useful, especially near major levels. But divergence alone is not enough. Confirmation is still needed.
Can beginners use reversal indicators?
Yes, but beginners should start with simple rules and avoid counter-trend trades during strong momentum phases.
What is the biggest danger?
The biggest danger is entering too early and fighting a strong trend before the market has shown any real sign of weakness.
🏁 Final Thoughts
A Trend Reversal Indicator can be a powerful tool when it is used with structure, momentum, liquidity, and proper risk management. It becomes dangerous only when traders treat every signal as a guaranteed turning point.
The real edge is not in finding a perfect indicator. The edge is in knowing which reversal signals deserve attention — and which ones should be ignored. When you combine technical confirmation with patience and disciplined risk control, reversal trading becomes less about guessing tops and bottoms and more about reading the moment when control truly changes hands.
Risk Disclaimer: Trading Forex and CFDs involves risk and may not be suitable for every trader. Technical indicators, reversal signals, and chart-based strategies do not guarantee future results. Always test your method, manage position size carefully, and never risk money you cannot afford to lose.