🌥️ Why Ichimoku Still Matters in Forex
Ichimoku Kinko Hyo is one of the few technical analysis systems that can give a trader a complete market view in one chart. Instead of asking only “is price going up or down?”, Ichimoku asks a better question: is the market in balance, trending, or becoming vulnerable?
The name is often translated as “one glance equilibrium chart”. That is exactly the point. A good Ichimoku setup should let you assess the trend, momentum, key support and resistance zones, and the quality of a possible trade without adding five different indicators on top of each other.
In Forex, where price can move from quiet Asian-session ranges to aggressive active-session breakouts, Ichimoku is valuable because it gives structure. It helps you avoid random entries, late trend chasing, and trades taken directly into hidden resistance.
Many beginners see Ichimoku for the first time and think it looks complicated. Five lines, a cloud, forward-shifted levels, and one line pushed into the past can feel overwhelming. But once you understand the role of each component, the system becomes surprisingly logical. This article breaks it down in a practical, trader-friendly way.
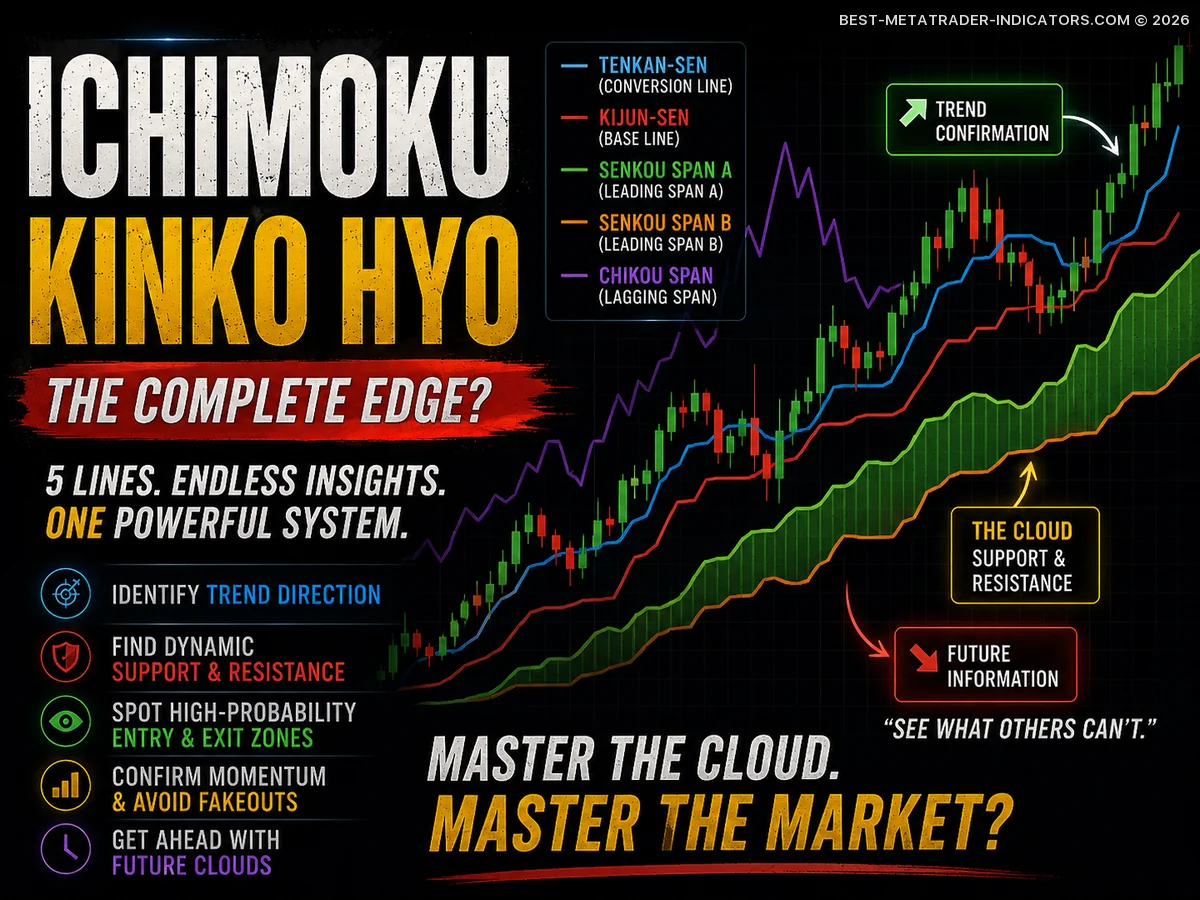
🧩 The Five Ichimoku Components Explained
Ichimoku is built from five core elements. Each one has a job. The mistake many traders make is treating every line as a separate signal. Experienced traders read the lines together as a market map.
| Component | Common Name | Main Purpose | Trader’s Interpretation |
|---|---|---|---|
| Tenkan-sen | Conversion Line | Short-term momentum | Shows the recent pulse of price. A rising Tenkan suggests short-term bullish pressure. |
| Kijun-sen | Base Line | Medium-term balance | Acts like a dynamic equilibrium level. Price often reacts around it during pullbacks. |
| Senkou Span A | Leading Span A | Cloud boundary | Forms one side of the Kumo and helps project future support or resistance. |
| Senkou Span B | Leading Span B | Major cloud boundary | Represents deeper market balance and often marks stronger support or resistance. |
| Chikou Span | Lagging Line | Confirmation | Compares today’s price with past price action to confirm whether the market has room to move. |
🧩 The Missing Piece Behind Cleaner Forex Entries and Exits


☁️ The Kumo Cloud: The Heart of Ichimoku
The cloud, or Kumo, is the most visually important part of Ichimoku. It is created by Senkou Span A and Senkou Span B. In practice, the cloud gives you a fast way to judge whether the market is trending, ranging, or transitioning.
📈 Price Above the Cloud
The market has a bullish structure. Long setups usually have higher quality when price is above the cloud and the cloud ahead is also bullish.
📉 Price Below the Cloud
The market has a bearish structure. Short setups are usually cleaner when price is below the cloud and rallies fail near the Kijun or Kumo.
↔️ Price Inside the Cloud
The market is in transition or consolidation. Breakouts can happen, but false signals are common. Patience matters here.
💡 Professional Tip
Do not treat the cloud as a magic wall. Think of it as a zone of market memory. Thick clouds often suggest stronger support or resistance. Thin clouds can be easier to break, but they can also signal fragile trend structure.
⚙️ Standard Ichimoku Settings
The classic Ichimoku settings are 9, 26, 52. These numbers came from the original Japanese trading calendar. Many modern traders still use them because the system’s internal balance depends on the relationship between the lines.
| Setting | Used For | Meaning | Should You Change It? |
|---|---|---|---|
| 9 | Tenkan-sen | Short-term price equilibrium | Usually keep it standard unless you have tested alternatives. |
| 26 | Kijun-sen and displacement | Medium-term balance and forward/backward shift | Best left unchanged for consistency. |
| 52 | Senkou Span B | Longer-term price equilibrium | Changing it can significantly alter cloud structure. |
For most Forex traders, the default settings are enough. The edge usually does not come from changing the numbers. It comes from understanding context, avoiding low-quality signals, and managing risk properly.
🎯 Core Ichimoku Trading Signals
Ichimoku can produce several signals, but not all signals are equal. A signal that appears in the direction of the higher-timeframe trend and away from major resistance is far stronger than the same signal inside a choppy cloud.
🔁 Tenkan-Kijun Cross
A bullish cross happens when the Tenkan-sen moves above the Kijun-sen. A bearish cross happens when Tenkan moves below Kijun. The signal is stronger when it happens above the cloud for buys or below the cloud for sells.
☁️ Kumo Breakout
A bullish Kumo breakout happens when price closes above the cloud. A bearish breakout happens when price closes below it. The best breakouts usually happen after compression, not after a huge exhausted candle.
↩️ Kijun Pullback
In a strong trend, price often pulls back toward the Kijun-sen before continuing. This can offer better risk-to-reward than chasing a breakout candle.
⏳ Chikou Confirmation
The Chikou Span should have open space. If it is trapped in old candles, support, resistance, or the cloud, the trade may struggle.
📈 Strategy 1: Trend Continuation with Kijun Pullback
This is one of the cleanest ways to use Ichimoku in Forex. Instead of buying after price has already exploded, you wait for price to return toward balance.
✅ Bullish Setup Rules
- Price is above the Kumo cloud.
- The future cloud is bullish, with Senkou Span A above Senkou Span B.
- Tenkan-sen is above Kijun-sen or crossing back above it.
- Price pulls back toward the Kijun-sen without closing deeply inside the cloud.
- Chikou Span is above price from 26 periods ago and has room to move.
- Entry is considered after a bullish rejection candle, structure break, or momentum close.
For bearish trades, reverse the logic. Price should be below the cloud, the future cloud should be bearish, Tenkan should be below Kijun, and rallies toward Kijun should fail.
🛡️ Risk Management Idea
A common stop-loss location is beyond the recent swing point or beyond the opposite side of the Kijun reaction area. Avoid placing stops exactly on the Kijun-sen because price often probes around that line before continuing.
🚀 Strategy 2: Kumo Breakout for New Trends
A Kumo breakout tries to capture a new trend as price escapes a period of balance. This strategy can work well on major Forex pairs when volatility expands after a quiet range.
📋 Kumo Breakout Checklist
- Price closes clearly outside the cloud, not just a small wick through it.
- The breakout candle is not extremely overextended compared with recent candles.
- Tenkan and Kijun support the direction of the breakout.
- The Chikou Span is not blocked by old price structure.
- The future cloud begins to turn in the direction of the trade.
- The breakout is aligned with the higher-timeframe bias, or at least not fighting a major level.
The biggest risk with Kumo breakout trading is buying the top of a move or selling the bottom of a move. That is why experienced traders often wait for a breakout, then a retest, then confirmation.
🧠 Strategy 3: Multi-Timeframe Ichimoku
Ichimoku becomes more powerful when you use it across timeframes. A simple approach is to use the higher timeframe for direction and the lower timeframe for timing.
Multi-Timeframe Example for Forex
Use the higher timeframe to define the battlefield. Use the execution timeframe to choose the entry.
| Trader Type | Bias Timeframe | Entry Timeframe | Best Use |
|---|---|---|---|
| ScalperFast intraday trader | 1H | 5M or 15M | Short momentum bursts during active sessions. |
| Day TraderIntraday setups | 4H | 15M or 1H | active-session continuation and pullback trades. |
| Swing TraderMulti-day positions | Daily | 4H | Trend continuation, Kijun pullbacks, and cloud breakouts. |
For example, if EUR/USD is above the daily cloud and the future cloud is bullish, a day trader may look for 4H or 1H pullbacks to the Kijun-sen instead of shorting every intraday dip.
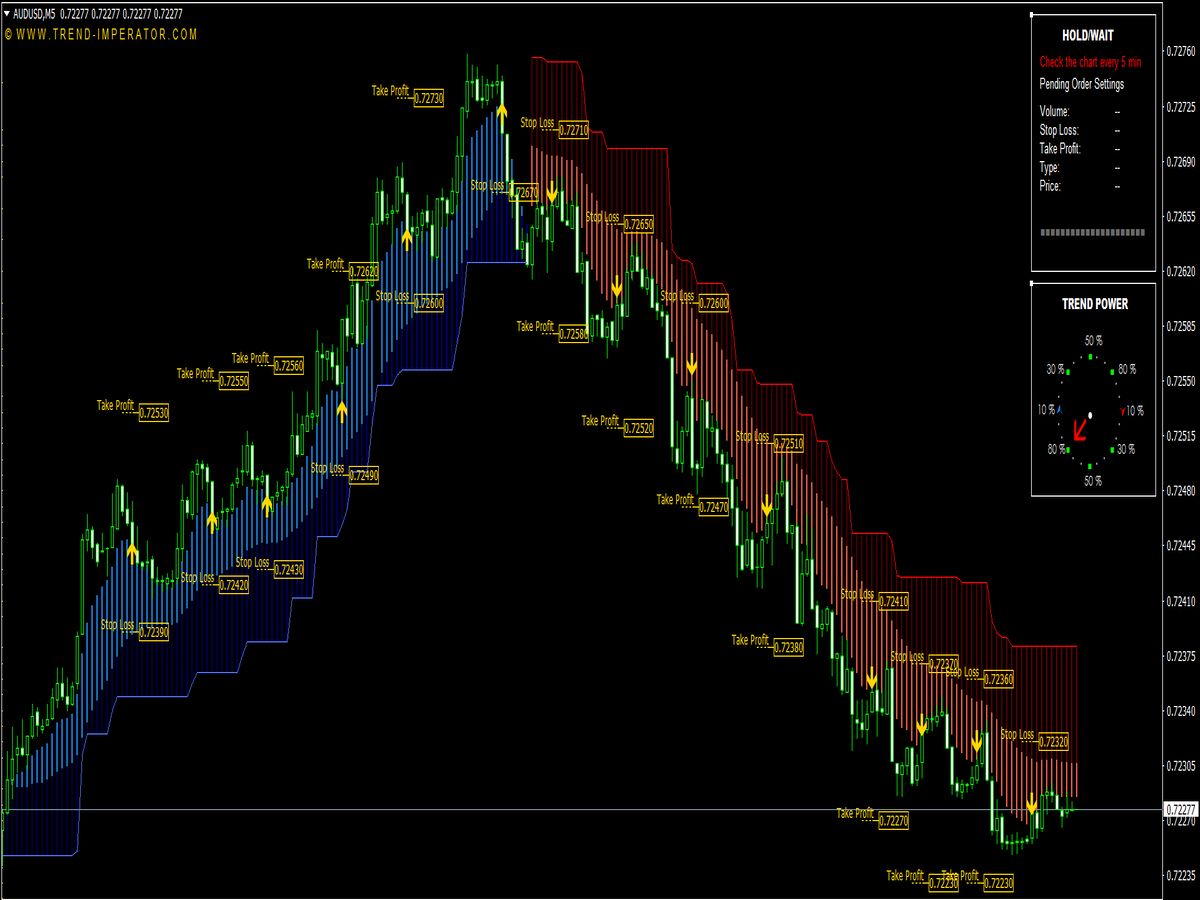
📡 Advanced Signal Intelligence for MT4 & MT5 Traders
🧭 How to Read Market Context with Ichimoku
The best Ichimoku traders do not ask, “Where is the next signal?” They ask, “What is the current market condition?” That question filters out many bad trades.
| Market Condition | Ichimoku Appearance | Preferred Action |
|---|---|---|
| Strong Bull Trend | Price above cloud, Tenkan above Kijun, bullish future cloud | Look for long pullbacks, avoid early shorts. |
| Strong Bear Trend | Price below cloud, Tenkan below Kijun, bearish future cloud | Look for short rallies, avoid catching falling knives. |
| Range | Price inside or around cloud, flat Kijun, messy Chikou | Reduce size, wait, or use range-specific tactics. |
| Transition | Cloud twist, price crossing Kumo, mixed signals | Wait for confirmation. False breakouts are common. |
🕒 Best Timeframes for Ichimoku in Forex
Ichimoku can be used on many timeframes, but it is generally more reliable when the chart has enough price history and less random noise. The lower you go, the more spreads, volatility spikes, and session transitions can distort signals.
✅ Better for Most Traders
- 4H charts for swing and position bias
- Daily charts for major trend direction
- 1H charts for intraday structure
- 15M charts for carefully timed entries
⚠️ More Difficult
- 1M and 5M charts during low liquidity
- Trading directly during unstable volatility windows
- Taking signals inside the cloud
- Ignoring spread and execution quality
💱 Ichimoku Ideas by Currency Pair Type
Different Forex pairs behave differently. Ichimoku is not a one-size-fits-all button. The character of the pair matters.
| Pair Type | Typical Behavior | Ichimoku Approach |
|---|---|---|
| EUR/USD, GBP/USD | Liquid, session-driven, trend and range phases | Good for 1H/4H trend filters and Kijun pullbacks. |
| USD/JPY, EUR/JPY | Can trend strongly when yields and risk sentiment align | Useful for cloud breakouts and trend continuation setups. |
| AUD/USD, NZD/USD | Often produces clean swings but can turn sharply when volatility expands | Combine Ichimoku with support, resistance, session timing, and stricter stop placement. |
| Exotic pairs | Wider spreads, lower liquidity, sharper gaps | Use higher timeframes and stricter risk controls. |
✅ Advantages of Ichimoku
🟢 Strengths
- Shows trend, momentum, support and resistance in one system.
- Helps traders avoid countertrend trades.
- Works well with multi-timeframe analysis.
- Gives visual structure to uncertain markets.
- Can reduce indicator overload.
🔴 Limitations
- Can look confusing for beginners.
- Produces false signals in choppy markets.
- Signals may appear late after strong moves.
- Requires patience and context reading.
- Does not replace risk management.
⚠️ Common Ichimoku Mistakes
🚫 Avoid These Errors
- Trading every Tenkan-Kijun cross: A cross inside the cloud is often low quality.
- Ignoring the Chikou Span: If it is trapped in old price action, the trade may lack space.
- Entering after huge candles: The signal may be valid, but the risk-to-reward may be poor.
- Ignoring volatility conditions: Sudden volatility expansion can distort technical structure in seconds.
- Using Ichimoku as a prediction machine: It is a decision framework, not a crystal ball.
📋 Practical Ichimoku Trade Checklist
Before entering a trade, use this checklist. It helps slow down emotional decisions and keeps your process consistent.
Pre-Trade Checklist
- Is price above, below, or inside the cloud?
- Is the future cloud supporting my trade direction?
- Are Tenkan and Kijun aligned with the trade idea?
- Is the Kijun-sen flat or angled in the direction of the trend?
- Does the Chikou Span have enough open space?
- Is there nearby support or resistance blocking the trade?
- Is the higher timeframe aligned or at least neutral?
- Are current volatility and liquidity conditions suitable for entry?
- Is the stop-loss logical, not random?
- Does the trade offer acceptable risk-to-reward?
🛠️ Combining Ichimoku with Other Tools
Ichimoku is already a complete system, so adding too many indicators can create confusion. However, a few simple tools can improve decision quality.
📍 Support & Resistance
Mark major swing highs, swing lows, weekly levels and session highs/lows. Ichimoku signals are stronger when they do not run directly into these zones.
📰 Volatility Timing
Avoid fresh entries when spreads widen, candles become erratic, or liquidity conditions make clean technical execution difficult.
📊 Price Action
Candlestick rejection, structure breaks, and clean closes can help confirm whether an Ichimoku level is being respected.
🔍 Example Trade Logic: Bullish EUR/USD Scenario
Imagine EUR/USD is trading above the 4H cloud. The future cloud is bullish, Tenkan is above Kijun, and the daily chart is also above its Kijun-sen. Price pulls back during the Asian session and tests the 4H Kijun without closing inside the cloud. During the active session, a bullish candle closes back above the Tenkan-sen.
✅ Why This Setup Is Interesting
- The higher-timeframe structure supports long trades.
- The pullback gives a better entry than chasing the original move.
- The Kijun-sen acts as a logical balance area.
- The Chikou Span has open space, which means less historical resistance.
- The stop can be placed below the pullback structure, not randomly.
This does not mean the trade must win. It means the trade has a coherent reason to exist. Professional trading is not about certainty. It is about repeatedly taking well-structured opportunities with controlled risk.
📊 Ichimoku vs Moving Averages
Many traders compare Ichimoku with moving averages because both can define trend direction. But Ichimoku provides more information than a simple moving average crossover.
Indicator Comparison
Ichimoku is not just a trend line. It is a broader market structure tool.
| Feature | Ichimoku Kinko Hyo | Moving Averages |
|---|---|---|
| Trend Direction | Yes, through price vs cloud and line alignment. | Yes, through slope and crossovers. |
| Support & Resistance | Dynamic zones through Kijun and Kumo. | Usually limited to average lines. |
| Momentum | Tenkan-Kijun relationship gives momentum clues. | Crossovers and spacing can show momentum. |
| Future Structure | Cloud is projected forward. | No forward structure by default. |
| Learning Curve | Higher at first, but deeper once understood. | Easier to start, but often less complete. |
📌 Advanced Notes from a Trader’s Perspective
🧠 Flat Kijun and Flat Senkou Span B Matter
Flat Ichimoku levels often behave like magnets. When the Kijun-sen or Senkou Span B is flat, it means price equilibrium has not changed for several periods. Markets often revisit these levels before deciding the next direction.
🧠 Cloud Twists Are Warnings, Not Automatic Signals
A cloud twist shows a possible shift in structure. It does not mean you should immediately reverse your position. Wait for price action and line alignment to confirm the transition.
🧠 Strong Trends Can Stay Far from Kijun
In powerful trends, price may ride the Tenkan-sen and never offer a deep Kijun pullback. Do not force entries. Either wait for a shallow continuation setup or accept that the trade has already left without you.
🚀 Advanced Forex Tools for Traders Who Want an Edge
❓ Ichimoku FAQ
Is Ichimoku good for beginners?
Yes, but only if beginners learn it step by step. Start with price versus cloud, then add Tenkan, Kijun, and Chikou confirmation.
Does Ichimoku work on all Forex pairs?
It can be applied to all pairs, but cleaner, more liquid pairs usually produce better technical structure than thin exotic pairs.
What is the best Ichimoku signal?
There is no single best signal. A Kijun pullback in the direction of a strong higher-timeframe trend is often more reliable than a random crossover.
Should I use Ichimoku alone?
You can, but it is smart to combine it with risk management, major support and resistance, and volatility awareness.
Can Ichimoku be used for scalping?
Yes, but lower timeframes produce more noise. Scalpers should be very selective and avoid trading during poor liquidity.
Why is the Chikou Span important?
It helps confirm whether current price has enough room compared with past price action. If Chikou is blocked, the trade may become messy.
🏁 Final Thoughts
Ichimoku Kinko Hyo is not just an indicator. It is a complete way of reading market balance. It teaches traders to think in terms of structure, not isolated signals. That is why it remains relevant in modern Forex trading.
The real power of Ichimoku appears when you stop looking for perfect entries and start asking better questions: Is the market trending? Is the trade aligned with structure? Is there room for price to move? Is my risk controlled?
Used with patience, multi-timeframe awareness, and disciplined risk management, Ichimoku can become a clear and practical trading framework. Used carelessly, it becomes just another colorful chart overlay. The difference is not the indicator. The difference is the trader’s process.
Risk Disclaimer: Forex trading involves significant risk and is not suitable for every investor. Ichimoku signals can fail, and no strategy guarantees profits. Always test your method, use proper position sizing, and never risk money you cannot afford to lose.
📌 Great Indicators and Trading Systems for MT4 or MT5
- Top-Rated MetaTrader Indicators


- Ichimoku MTF Smoothed Indicator

- Ichimoku Wajdyss V1 Indicator

- Wajdyss Ichimoku Indicator

- Supply and Demand Indicator:…

- Ichimoku Line Alert V3 Indicator

- Volume Profile Indicator…

- Ichimoku Monitor V4 Indicator

- Lternative Ichimoku Indicator

- Ichimoku Trend Magic Indicator

- Best Beginner Forex Indicators…

- Ichimoku MTF Alerts Indicator

- Ichimoku Guppy Alligator V2 Indicator

- Ichimoku Trend Monitor Indicator

- Ichimoku Senkoua Envelope Indicator

- Ichimoku MTF Indicator

- Best Scalping Indicator for…

- Liquidity Indicator: Find the…

- Fractal Ichimoku V1 Indicator

- Inside the Stochastic…

- How Smart Traders Use the Fair…

- Non-Repainting Non-Lagging Indicators