Bollinger Bands are not magic lines. They are a volatility framework. Used well, they can help you understand when a currency pair is quiet, when it is expanding, when price may be stretched, and when the market is simply too messy to trade.
After more than two decades of watching Forex markets move through trending sessions, fake breakouts, volatility spikes and dead ranges, one lesson stands out: the trader who understands volatility usually makes better decisions than the trader who only looks for “buy” or “sell” signals.
This guide explains Bollinger Bands in a practical way: how they work, how to read them, which strategies traders use, what mistakes to avoid, and how to turn the indicator into a repeatable trading checklist.
🧠 What Are Bollinger Bands?
Bollinger Bands are a technical analysis tool built around a moving average and two volatility bands. The middle line is usually a 20-period simple moving average. The upper and lower bands are commonly set two standard deviations away from that average.
In simple words: Bollinger Bands show how far price has moved away from its recent average. When volatility increases, the bands widen. When volatility decreases, the bands contract.
📌 The three parts of Bollinger Bands
- Middle Band: The moving average, often used as a short-term fair value line.
- Upper Band: A volatility boundary above price’s average.
- Lower Band: A volatility boundary below price’s average.
🧩 The Market Leaves Clues. Most Traders Miss Them.


⚙️ How Bollinger Bands Work in Forex
Forex markets constantly shift between active order flow, slow ranges, aggressive breakouts and thin-session noise. That means volatility does not stay constant. EUR/USD during the London-New York overlap behaves differently from EUR/USD during a quiet Asian session. Bollinger Bands make those changes visible without forcing the trader to guess.
When the bands are narrow, the market is often building pressure. When the bands expand, that pressure is being released. But here is the part that separates careful traders from reactive ones: wide bands do not automatically mean reversal, and narrow bands do not automatically mean breakout. Structure still has to confirm the idea.
| Band Behavior | What It Often Suggests | Trader’s Focus |
|---|---|---|
| Narrow bands | Low volatility, compression, possible setup phase | Prepare for breakout or false breakout |
| Expanding bands | Volatility increase, momentum entering the market | Look for continuation or controlled pullbacks |
| Price riding upper band | Strong bullish momentum | Avoid premature shorts without confirmation |
| Price riding lower band | Strong bearish momentum | Avoid premature longs without confirmation |
| Price returning to middle band | Mean reversion or trend pullback | Decide whether it is a retracement or reversal |
📈 The Most Common Bollinger Band Settings
The standard setting is 20 periods with 2 standard deviations. It is a sensible starting point in MetaTrader because it is widely used and gives a balanced view of volatility. Still, experienced traders often adjust settings only after testing them against their timeframe, execution style and typical stop-loss distance.
⚡ Scalping
Short-term traders may use 10 to 20 periods on M1, M5 or M15 MetaTrader charts. The goal is to read quick volatility shifts, but noise increases dramatically, so entries need tighter rules and faster invalidation.
🎯 Intraday Trading
The classic 20-period setting works well on M15, M30 and H1 charts. It balances signal frequency with market structure and usually leaves enough room to plan a realistic stop loss and take profit.
🧭 Swing Trading
H4 and daily traders often keep the standard setting or increase the period to smooth out market noise and focus on bigger moves. The slower pace also makes it easier to judge whether the trade idea still fits the broader swing structure.
📝 Trader’s Note
Do not optimize Bollinger Band settings until they look perfect on historical charts. That is curve-fitting. A robust strategy should make sense across different pairs, sessions and market conditions.
🔍 Reading Bollinger Bands Like a Trader
Beginners often make the same mistake: they sell when price touches the upper band and buy when price touches the lower band. Sometimes that works in a range. In a strong trend, it can be expensive.
A better question is not “Did price touch the band?” The better question is: What type of market am I trading right now?
Before entering a Bollinger Band trade, first identify the market environment.
| Market Type | Band Interpretation | Possible Approach | Main Risk |
|---|---|---|---|
| RangeSideways market | Upper and lower bands may act as exhaustion zones. | Mean reversion with confirmation. | Breakout against the position. |
| TrendDirectional market | Price can keep pushing along one band. | Trade pullbacks toward the middle band. | Entering reversals too early. |
| CompressionLow volatility phase | Bands squeeze together before possible expansion. | Wait for breakout and confirmation. | False breakout and whipsaw. |
| Volatility SpikeFast, unstable movement | Bands expand quickly and price may overshoot normal structure. | Reduce size or stay out until candles normalize. | Slippage, spread widening and emotional trades. |
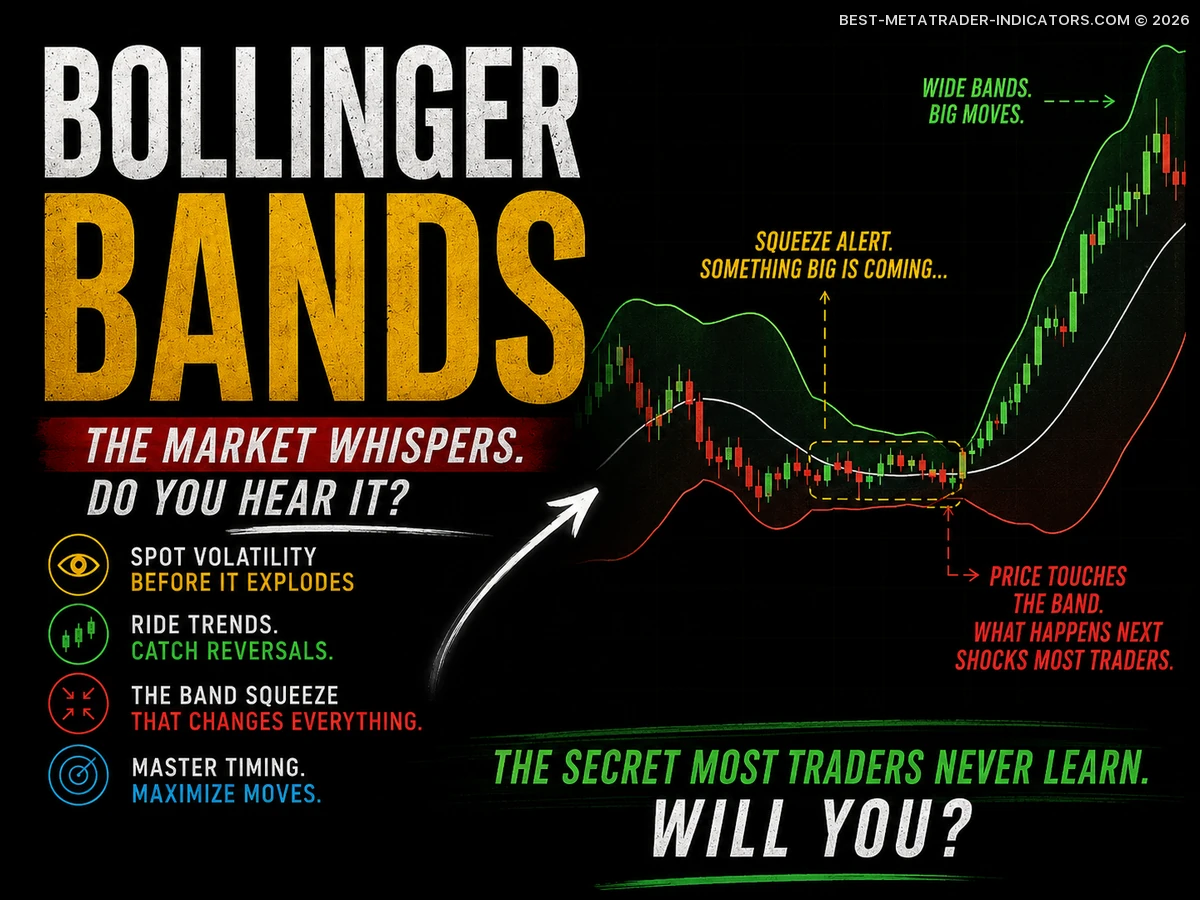
🚀 Strategy 1: The Bollinger Band Squeeze Breakout
The squeeze is one of the most popular Bollinger Band concepts. It happens when volatility contracts and the bands become unusually tight. This often appears before a larger move, because quiet markets rarely stay quiet forever.
✅ Basic squeeze breakout idea
- Find a currency pair where the bands are narrow compared with recent price action.
- Mark nearby support and resistance.
- Wait for a candle close outside the range or outside the band.
- Confirm with momentum, volume proxy, session timing or market structure.
- Place the stop behind the breakout structure, not randomly inside the noise.
The squeeze works best when it appears near an important level or after a clear consolidation. A squeeze in the middle of nowhere can still break, but it often lacks a strong directional reason.
⚠️ Watch Out for False Breakouts
A breakout candle alone is not enough. Forex markets often trigger breakout traders, reverse sharply and return into the range. A safer approach is to wait for a breakout, a retest and then a continuation candle, even if that means entering later than the first impulsive move.
🔁 Strategy 2: Mean Reversion From the Outer Bands
Mean reversion means price moves away from its average and then returns toward it. Bollinger Bands are naturally useful for this because they show when price is stretched relative to recent volatility.
This strategy is usually better in sideways or slow markets, not in strong trends. The goal is to catch price returning from an outer band toward the middle band.
📉 Short setup idea
- Price touches or pierces the upper band.
- Market is ranging or near resistance.
- A rejection candle appears.
- Target is the middle band or opposite side of the range.
📈 Long setup idea
- Price touches or pierces the lower band.
- Market is ranging or near support.
- A bullish rejection candle appears.
- Target is the middle band or opposite side of the range.
📝 Practical Tip
The best mean reversion trades usually happen when Bollinger Bands align with horizontal support or resistance. A band touch alone is weak. A band touch at a proven level is much stronger.
📌 Strategy 3: Trend Pullbacks to the Middle Band
In a trending market, the middle band can behave like a dynamic pullback area. During a strong uptrend, price may repeatedly pull back toward the middle band and continue higher. During a downtrend, rallies into the middle band can offer continuation opportunities.
🎯 Trend continuation checklist
- Price is making higher highs and higher lows for longs, or lower highs and lower lows for shorts.
- The bands are angled in the direction of the trend.
- Price pulls back toward the middle band without breaking key structure.
- A rejection candle, engulfing pattern or small consolidation appears near the middle band.
- The trade has enough room before the next support or resistance zone.
This is often more professional than trying to catch tops and bottoms. The market already shows direction; the trader waits for a better price to join that direction.
🧩 Strategy 4: Bollinger Bands With RSI
Bollinger Bands show volatility and relative price location. RSI shows momentum. Combining them can help traders avoid weak signals, especially because both tools are available by default in MetaTrader and can be tested across different pairs and timeframes.
| Signal | Bollinger Band Context | RSI Confirmation Idea |
|---|---|---|
| Possible long | Price rejects lower band near support | RSI leaves oversold area or forms bullish divergence |
| Possible short | Price rejects upper band near resistance | RSI leaves overbought area or forms bearish divergence |
| Trend continuation long | Price pulls back to middle band in uptrend | RSI holds above the midline |
| Trend continuation short | Price rallies to middle band in downtrend | RSI stays below the midline |
The goal is not to add indicators until the chart becomes confusing. The cleaner approach is to give each tool a job: Bollinger Bands for volatility, RSI for momentum, and price structure for the final trading decision.
📈 Accurate Non-Repainting Indicators for MT4 and MT5
🛡️ Risk Management With Bollinger Bands
No indicator removes risk. Bollinger Bands can improve context, but the trade still needs a stop-loss, position size and invalidation point.
✅ Better risk habits
- Risk a fixed percentage per trade.
- Place stops beyond structure, not just beyond a band.
- Avoid trading during unstable volatility windows unless your strategy is designed for them.
- Reduce size when spreads widen, candles stretch beyond normal rhythm, or volatility becomes unstable.
- Accept that a good setup can still lose.
❌ Common risk mistakes
- Buying every lower band touch blindly.
- Selling every upper band touch blindly.
- Moving the stop because the band expanded.
- Using the same lot size on every pair without considering pip value.
- Trading squeeze breakouts without waiting for confirmation.
⚠️ Important Risk Reminder
Forex trading involves substantial risk and is not suitable for every investor. Bollinger Bands can help structure decisions, but they cannot predict the next candle. Test the setup first, use responsible position sizing, and never risk money you cannot afford to lose.
💡 Professional Tips for Using Bollinger Bands
Most traders do not fail because Bollinger Bands are bad. They fail because they use the indicator without context. Here are practical tips that can make the tool more useful.
🔎 Tip 1: Start with market structure
Before reading the bands, mark support, resistance, trend direction and recent swing points. The bands make more sense after structure is clear.
⏰ Tip 2: Respect session timing
A Bollinger Band breakout during low-liquidity hours is not the same as a breakout during London or New York activity. Session quality often decides whether a clean signal has enough participation behind it.
📏 Tip 3: Measure distance to targets
A setup is not automatically good because the signal is clean. Make sure there is enough room before the next major level.
🧘 Tip 4: Wait for the candle close
Many false signals appear before a candle closes. Waiting reduces frequency but often improves decision quality.
⚖️ Advantages and Disadvantages of Bollinger Bands
Bollinger Bands are powerful, but they have clear limitations.
| Advantages | Disadvantages | Best Solution |
|---|---|---|
| They adapt to volatilityBands expand and contract automatically. | They do not tell you the exact future direction. | Combine with trend and structure analysis. |
| They work on many timeframesUseful for scalpers, intraday traders and swing traders. | Lower timeframes can produce noisy signals. | Use higher timeframe context. |
| They highlight overextensionUseful for spotting stretched moves. | Strong trends can stay overextended for a long time. | Do not fade trends without confirmation. |
| They help detect compressionSqueezes can prepare traders for expansion. | Squeeze breakouts can fail quickly. | Wait for retests or continuation candles. |
✅ Bollinger Band Trading Checklist
Before placing a trade, go through this checklist. It can prevent impulsive entries and help you trade the setup instead of the emotion.
📋 Pre-trade checklist
- Have I identified the market type: trend, range, squeeze or unstable volatility spike?
- Is the signal aligned with support, resistance or a higher timeframe level?
- Did the candle close, or am I reacting too early?
- Is there confirmation from price action, RSI, momentum or structure?
- Where is my stop-loss and what would prove the trade idea wrong?
- Is the reward-to-risk ratio acceptable?
- Am I trading during a liquid session?
- Is volatility stable enough for my stop-loss distance?
- Am I following my plan or trying to recover a previous loss?
🧪 Example Trade Ideas
These are educational examples, not financial advice. The goal is to understand how a trader might think with Bollinger Bands before planning entry, stop loss and take profit.
📈 EUR/USD trend pullback idea
EUR/USD is in an uptrend on H1. Price rides the upper band, then pulls back to the middle band. The pullback holds above the previous swing low. A bullish rejection candle forms near the middle band. A trader may look for a long setup with a stop below the swing low and a target near the recent high.
📉 GBP/JPY squeeze breakout idea
GBP/JPY consolidates before the London session. Bollinger Bands tighten on M15. Price breaks resistance with a strong candle and the bands start expanding. Instead of chasing, a trader waits for a retest of the breakout level and enters only if buyers defend it.
🧠 Advanced Ideas for Experienced Traders
Once you understand the basics, Bollinger Bands can be used in more advanced ways. The key is to avoid making the chart too complicated.
🔬 Advanced concepts to test
- Multi-timeframe bands: Use daily bands for direction and H1 bands for entries.
- Band walk analysis: Study how price behaves when it repeatedly closes near one band.
- Volatility regime filters: Trade different strategies when bands are expanding versus contracting.
- Divergence with bands: Watch for price making a new outer band push while RSI fails to confirm.
- Middle band rejection: Treat the middle band as a decision zone in trending markets.
❌ Mistakes That Make Bollinger Bands Look Worse Than They Are
The indicator is often blamed for losses that actually come from poor execution. These mistakes are especially common among newer traders.
🚫 Avoid these habits
- Taking trades without checking the higher timeframe.
- Assuming every band touch is a reversal.
- Ignoring session conditions and sudden spread expansion.
- Entering immediately after a large candle when the stop becomes too wide.
- Adding indicators that all say the same thing.
- Changing settings after every losing trade.
- Backtesting only the winning examples you like.
🧭 A Simple Bollinger Band Trading Plan
Here is a clean framework you can adapt and test. Keep it simple first. Complexity should only be added when it solves a real problem.
| Step | Question | Action |
|---|---|---|
| 1 | What is the higher timeframe doing? | Identify trend, range and key levels. |
| 2 | Are bands expanding or contracting? | Choose breakout, continuation or mean reversion logic. |
| 3 | Is price at an important zone? | Trade only near structure, not random band touches. |
| 4 | Is there confirmation? | Wait for candle close, rejection, retest or momentum signal. |
| 5 | Where is invalidation? | Place stop where the trade idea is clearly wrong. |
| 6 | Is the reward worth the risk? | Skip trades with poor potential before the next level. |
🎯 Precision Forex Tools for Confident Trading Decisions
❓ Bollinger Bands FAQ
Are Bollinger Bands good for Forex trading?
Yes, they can be useful because Forex markets move through changing volatility conditions. They are best used with market structure, trend analysis and risk management.
What is the best Bollinger Band setting?
The classic 20-period moving average with 2 standard deviations is a strong starting point. Traders may adjust it after testing, but the setting should match the timeframe and strategy.
Should I buy when price touches the lower band?
Not automatically. In a strong downtrend, price can keep moving along the lower band. Look for support, rejection, divergence or other confirmation first.
Should I sell when price touches the upper band?
Not automatically. In a strong uptrend, price can repeatedly touch the upper band. A short trade needs reversal evidence, not just a band touch.
Do Bollinger Bands work better with RSI?
They can. Bollinger Bands show volatility and price location, while RSI can help confirm momentum, exhaustion or divergence.
Can beginners use Bollinger Bands?
Yes, but beginners should avoid using them as a standalone buy/sell system. Start by learning trend, range, support and resistance first.
🏁 Final Thoughts
Bollinger Bands are one of the most practical indicators in Forex because they make volatility visible. They can help you spot compression, expansion, pullbacks and overextended price action. But they work best when used as part of a complete trading process.
The real edge is not in the indicator itself. The edge is in how you read context, wait for confirmation, manage risk and stay disciplined when the market tempts you to act too early or widen a stop after the trade is already live.
Use Bollinger Bands as a decision framework, not as a prediction machine. That mindset alone can make your trading more patient, more structured and more professional.
Disclaimer: This article is for educational purposes only and does not provide investment advice, trading signals or a recommendation to buy or sell any financial instrument. Trading involves risk, and every strategy should be tested independently before real capital is used.
📌 Great Indicators and Trading Systems for MT4 or MT5
- Top-Rated MetaTrader Indicators


- Volume Profile Indicator…

- Bollinger Bands Analyzer V2 Indicator

- BB Stops Jurik (JMA) Indicator
 Indicator")
- Bollinger Bandwidth Indicator

- Bollinger Cracker Forex Indicator

- BB Stops Smoothed WPR Indicator

- Bollinger Bands (BB) MACD Indicator
 MACD Indicator")
- The Best Indicator for…

- Supply and Demand Indicator:…

- Bollinger Bands (BB) Indicator
 Indicator")
- Bollinger Squeeze MACD Indicator

- Order Block Indicator Secrets…

- BB MACD Cloud Indicator

- Liquidity Indicator: Find the…

- Adx Bollinger Wa Indicator

- BB-Decimal Indicator

- Can AI Trading Indicators…

- Inside the Stochastic…

- BB Stops Velocity Indicator

- BB Cloud Indicator (MQL5)
")
- Non-Repainting Non-Lagging Indicators