The Moving Average Convergence Divergence indicator, better known as MACD, is one of the most practical momentum tools in technical trading. It is simple enough for newer traders to read, yet deep enough for experienced chartists to build clear decision frameworks around it.
After years of watching charts move through quiet ranges, volatility bursts, trend days, false breakouts, and tired reversals, I can say this clearly: MACD works best when you stop treating it as a standalone signal and start treating it as a conversation between price, momentum, and market structure.
Many traders open a chart, add MACD, wait for two lines to cross, and expect the setup to take care of itself. That is usually where the frustration starts. The real value of MACD is not the crossover by itself. The value is in understanding where the crossover happens, what price is doing at that moment, whether momentum agrees with the trend, and whether the trade location makes sense.
📌 What Is the MACD Indicator?
MACD stands for Moving Average Convergence Divergence. It is a momentum indicator that tracks the relationship between two exponential moving averages. In MetaTrader and most charting platforms, the default MACD settings are 12, 26, 9.
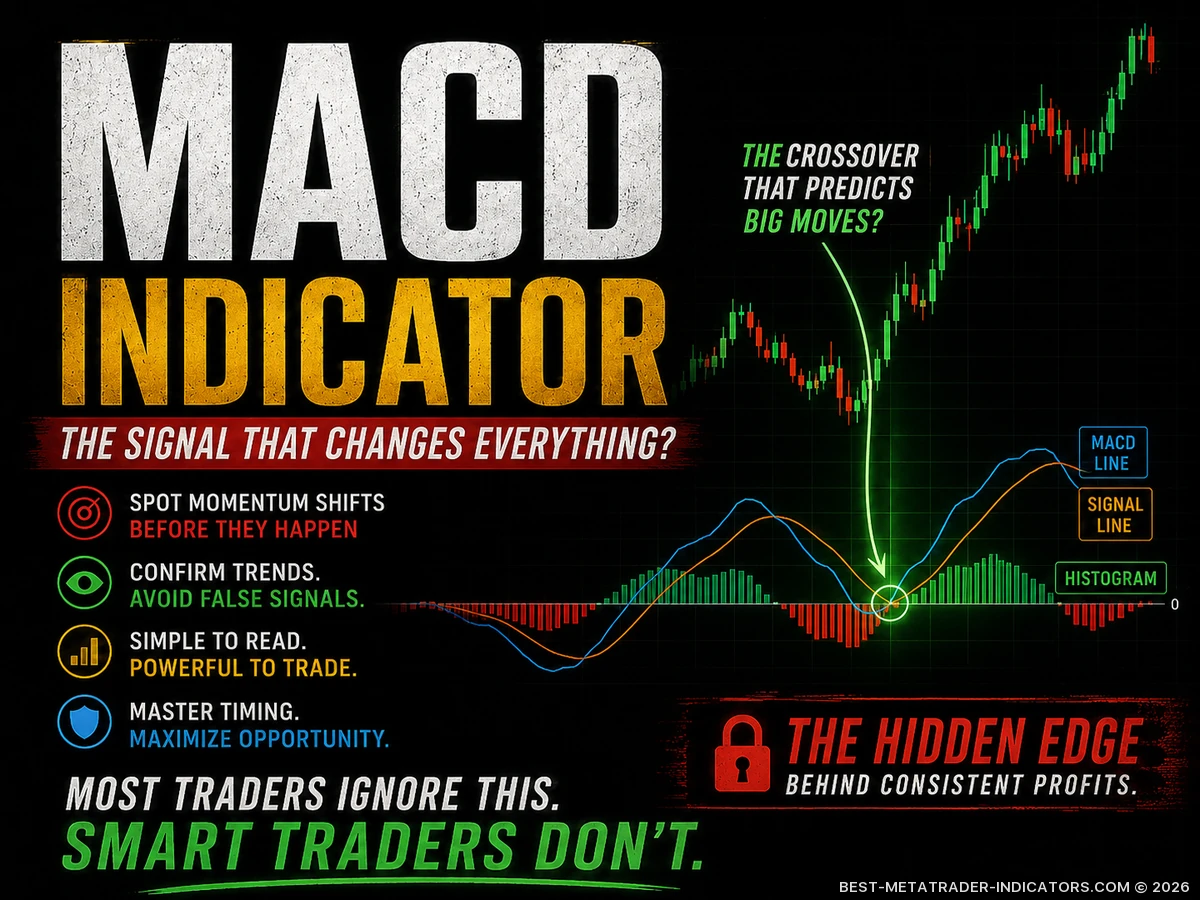
MACD Line
The MACD line is usually calculated by subtracting the 26-period EMA from the 12-period EMA. It reacts to shifts in short-term momentum.
Signal Line
The signal line is commonly a 9-period EMA of the MACD line. Traders use it to spot changes in momentum timing.
Histogram
The histogram shows the distance between the MACD line and the signal line. Expanding bars suggest momentum is increasing; shrinking bars suggest the move is losing pressure.
Professional note
MACD is a lagging momentum indicator. That does not make it useless. It means the signal confirms movement after price has already begun to move. The edge comes from combining that confirmation with price structure, not from trying to predict every turn.
🚀 Designed for Traders Who Want an Institutional Edge


🧠 Why Forex Traders Like MACD
Currency charts are heavily shaped by momentum. When directional pressure builds, price often moves in waves rather than straight lines. MACD helps traders see whether those waves are gaining strength or starting to fade.
- It helps identify momentum shifts without overcomplicating the chart.
- It works across many instruments and timeframes, including MetaTrader charts.
- It can support trend-following, pullback, breakout, and divergence-based strategies.
- It gives useful context when combined with support, resistance, trendlines, and moving averages.
- It helps traders avoid entering too late when momentum is already fading.
⚙️ MACD Settings Explained
The classic MACD setting is 12, 26, 9. Those numbers are not sacred. They are simply the default values that became widely accepted across MetaTrader and other charting platforms.
| Setting | Meaning | Trader Interpretation |
|---|---|---|
| 12 EMA | Fast exponential moving average | Responds more quickly to recent price movement |
| 26 EMA | Slow exponential moving average | Represents a smoother momentum baseline |
| 9 Signal Line | EMA of the MACD line | Used to create crossover and timing signals |
Shorter settings make MACD more sensitive and faster to react. Longer settings make it smoother, but also slower. A scalper may prefer faster settings, while a swing trader may prefer the default values or a slightly slower version. But changing settings will not repair poor trade selection. A weak setup remains weak, even when the indicator inputs look optimized.
📈 The Three Main MACD Signals
1. MACD Line Crossovers
A bullish crossover appears when the MACD line crosses above the signal line. A bearish crossover appears when the MACD line crosses below the signal line.
Best use: timing entries after a pullback within an existing trend.
2. Zero Line Crossovers
When MACD moves above the zero line, bullish momentum usually has the upper hand. When it moves below the zero line, bearish momentum usually has the upper hand.
Best use: confirming trend direction and momentum regime.
3. MACD Divergence
Divergence occurs when price makes a new high or low, but MACD does not confirm it. This can warn that the current move is losing strength.
Best use: warning that a trend may be tired, especially near support, resistance, or after a long extended move.
🔍 Bullish and Bearish MACD Signals
MACD Signal Comparison
Not every signal deserves an entry. The location of the signal matters as much as the signal itself.
| Signal Type | Bullish Interpretation | Bearish Interpretation | Best Market Condition |
|---|---|---|---|
| Signal Line CrossoverTiming signal | MACD line crosses above signal line | MACD line crosses below signal line | Trending or pullback markets |
| Zero Line CrossoverMomentum regime | MACD rises above zero | MACD falls below zero | Trend confirmation |
| Histogram ExpansionMomentum acceleration | Bars grow above zero | Bars grow below zero | Breakouts and strong trend continuation |
| DivergenceWarning signal | Price makes lower low, MACD makes higher low | Price makes higher high, MACD makes lower high | Exhausted moves near key levels |
🛠️ Strategy 1: MACD Trend Pullback Strategy
This is one of the cleanest ways to use MACD in technical trading. Instead of buying every bullish crossover or selling every bearish crossover, first define the market direction. Then use MACD to time entries during pullbacks.
Setup idea
- Identify an uptrend with higher highs and higher lows, or a downtrend with lower highs and lower lows.
- Wait for price to pull back toward a moving average, trendline, or previous support/resistance area.
- Watch MACD for a fresh crossover in the direction of the main trend.
- Enter only if price action confirms the idea with a rejection candle, a clean breakout candle, or structural continuation.
- Place the Stop Loss beyond the recent swing point, not randomly inside market noise.
The strength of this strategy is patience. You are not chasing price after the easy part of the move has already happened. You are waiting for the market to breathe, reset, and then show continuation.
🚀 Strategy 2: MACD Breakout Confirmation
Breakouts attract many traders, but false breakouts are common on active trading charts. MACD can help you judge whether the breakout has real momentum behind it.
Good breakout conditions
- Price breaks a clear support or resistance zone.
- MACD histogram expands in the breakout direction.
- The breakout candle closes beyond the level.
- Session momentum supports the move, where that context is visible on the chart.
Weak breakout conditions
- Price breaks the level but quickly returns inside the range.
- MACD histogram is flat or shrinking.
- The breakout runs directly into major higher-timeframe resistance or support.
- The move happens during a thin, low-participation session.
🔄 Strategy 3: MACD Divergence Reversal Strategy
Divergence is popular because it can warn traders before a reversal becomes obvious on price alone. Still, divergence by itself is not a trade. A market can keep trending for a long time while divergence continues to appear.
Important warning
Never short a strong uptrend only because bearish divergence appears. Never buy a strong downtrend only because bullish divergence appears. Divergence is a warning sign, not a command to enter.
A stronger divergence setup usually includes:
- A mature trend that has already traveled a meaningful distance.
- Price approaching a higher-timeframe support or resistance zone.
- A visible divergence between price and MACD.
- A break of a trendline, neckline, or minor market structure.
- A clear risk point that allows logical Stop Loss placement.
🧩 Strategy 4: MACD + 200 EMA Filter
The 200 EMA is often used as a simple trend filter. The aim is not to predict the future. The aim is to keep your trading decisions aligned with the broader directional pressure.
| Price Location | MACD Signal | Preferred Action |
|---|---|---|
| Price above 200 EMA | Bullish MACD crossover | Look for long setups after pullbacks |
| Price above 200 EMA | Bearish MACD crossover | Use caution; it may be only a correction |
| Price below 200 EMA | Bearish MACD crossover | Look for short setups after rallies |
| Price below 200 EMA | Bullish MACD crossover | Use caution; it may be only a bounce |
⚡ Premium Non-Lagging Indicators for MT4 and MT5
💡 Practical MACD Trading Tips
Tip 1: Read the histogram first
The histogram often gives an early clue that momentum is changing. If bars are shrinking while price continues higher, buyers may be losing power.
Tip 2: Avoid the middle of ranges
MACD signals inside a sideways range are often low quality. Wait for price to reach the edge of the range or break out with a clear close.
Tip 3: Use higher-timeframe context
A bullish MACD signal on the 15-minute chart carries more weight when the 1-hour or 4-hour chart supports the same direction.
Tip 4: Do not over-optimize
Changing MACD settings after every losing trade usually creates confusion. Build rules first, then test them consistently.
✅ MACD Trade Checklist
Before taking a MACD-based trade, run through this quick checklist:
- Is the market trending, ranging, or breaking out?
- Does the MACD signal align with the higher-timeframe bias?
- Is price near a meaningful support, resistance, trendline, or moving average?
- Is the histogram expanding in the direction of the trade?
- Is the entry too late after a large candle or extended move?
- Is there enough room to the next obstacle for a clean reward-to-risk ratio?
- Do I know exactly where my trade idea is invalidated and where the Stop Loss belongs?
- Am I taking this trade because of a real setup, or because I am bored and looking for action?
⚖️ Advantages and Disadvantages of MACD
MACD Pros and Cons
Every indicator has strengths and weaknesses. A disciplined trader respects both.
| Advantages | Disadvantages | Best Solution |
|---|---|---|
| Easy to understandClear lines and histogram | Can look deceptively simple | Create written rules for valid and invalid signals |
| Good momentum viewShows acceleration and weakness | Signals can appear late | Combine with price action and market structure |
| Useful across timeframesScalping to swing trading | More false signals in ranges | Use a trend or range filter before entering |
| Helps identify divergenceUseful reversal warning | Divergence can last a long time | Wait for structure break confirmation |
🧭 MACD vs RSI: Which Is Better?
MACD and RSI are both momentum tools, but they answer different questions on the chart. MACD focuses on the relationship between moving averages and momentum direction. RSI measures the speed and magnitude of price changes, often highlighting stretched conditions.
| Indicator | Best For | Common Mistake |
|---|---|---|
| MACD | Trend momentum, crossovers, divergence, continuation setups | Taking every crossover without market context |
| RSI | Overbought/oversold zones, momentum extremes, divergence | Selling simply because RSI is high or buying because RSI is low |
In practice, neither one is better in every situation. MACD is often more useful for trend confirmation, while RSI can help identify stretched price action. Some traders use both, but too many indicators can create hesitation and mixed signals. Keep the chart clean and the rules simple.
🧪 Example Trading Plan Using MACD
Simple swing trading framework
- Trade only markets with clean movement and reliable spreads.
- Use the 4-hour chart for direction and the 1-hour chart for entry timing.
- Trade long only when price is above the 200 EMA and market structure is bullish.
- Wait for a pullback into support, a trendline, or a previous breakout zone.
- Enter only after MACD gives a bullish crossover and the histogram starts expanding in the trade direction.
- Place the Stop Loss below the pullback low.
- Set Take Profit near the next resistance zone or use a trailing exit if momentum remains strong.
- Risk a fixed percentage per trade and never increase size after a loss out of emotion.
🧱 Common MACD Mistakes
Chasing late signals
When the MACD crossover appears after a large move, the best entry may already be gone. Wait for a pullback instead of buying the top or selling the bottom.
Ignoring support and resistance
A bullish MACD signal directly under major resistance is not attractive. A bearish signal directly above strong support is just as dangerous.
Trading during noisy sessions
Thin trading periods can create messy crossovers. Most instruments behave better during active sessions with real participation.
No risk plan
MACD can help with timing, but it cannot protect your account. Position sizing, Stop Loss placement, Take Profit planning, and trade selection still matter more than the indicator.
📋 MACD Rules I Would Give a Beginner
- Do not use MACD alone.
- Do not trade every crossover.
- Use MACD in the direction of the bigger trend first.
- Learn to read the histogram, not only the two lines.
- Avoid MACD signals in the middle of tight ranges.
- Respect support, resistance, and higher-timeframe structure.
- Backtest your rules before risking real money.
- Keep a trading journal with screenshots of every MACD setup you trade.
⚡ Professional FX Indicators That Give You the Trading Edge
❓ MACD Indicator FAQs
Is MACD good for Forex trading?
Yes, MACD can be useful because many tradable markets move in momentum waves. However, it should be combined with trend analysis, support and resistance, and risk management.
What is the best MACD setting?
The standard 12, 26, 9 setting is a good starting point in MetaTrader. Faster settings create more signals but also more noise. Slower settings reduce noise but may react later.
Can MACD predict reversals?
MACD can warn that momentum is weakening, especially through divergence, but it does not predict reversals with certainty. Confirmation from price action is essential.
Which timeframe works best with MACD?
MACD can work on many timeframes, but signals are usually cleaner on higher timeframes such as the 1-hour, 4-hour, and daily charts. Lower timeframes often produce more false signals.
Should I use MACD with RSI?
You can, but do not overload your chart. MACD is often better for trend momentum, while RSI can help identify stretched conditions. Use both only if each indicator has a clear role.
Why does MACD give false signals?
False signals happen most often in sideways markets, thin trading periods, and areas where price lacks direction. A trend filter can remove many poor signals before they reach your trade plan.
🏁 Final Thoughts: How to Use MACD Like a Professional
The MACD indicator is not useful because it gives perfect entries. It is useful because it helps traders read momentum in a structured way. Used poorly, it becomes another noisy signal generator. Used well, it becomes a practical decision-support tool.
My preferred approach is simple: define the market structure first, mark the key levels, read the higher-timeframe direction, and then use MACD to confirm whether momentum supports the trade idea. That order matters. Price first, context second, indicator third.
The best MACD traders are not the ones who know the most settings. They are the ones who know when not to trade.
Risk disclaimer: Trading involves substantial risk and is not suitable for every trader. The examples and strategies in this article are for educational purposes only and should not be treated as financial advice. Always test any strategy, manage risk carefully, define your Stop Loss and Take Profit before entry, and trade only with capital you can afford to lose.
📌 Great Indicators and Trading Systems for MT4 or MT5
- Top-Rated MetaTrader Indicators


- MACD Colored Indicator

- MACD Candles Indicator

- Footprint Indicator: The…

- MACD Trad Indicator

- MACD Crossover Alert Indicator

- Swing Trading Indicator Setups…

- Inside the Stochastic…

- Trend Reversal Indicator…

- Order Block Indicator Secrets…

- Can AI Trading Indicators…

- TMA MACD Indicator

- Profitable Forex Indicator:…

- MACD Crossover Indicator with…

- AFI MACD Indicator

- Best Hedge Fund Indicator…

- MACD Color Indicator

- Corrected MACD Indicator

- Volume Profile Indicator…

- Digital MACD V2 Indicator

- MACD Color Candles Indicator

- Non-Repainting Non-Lagging Indicators