The Stochastic Oscillator looks simple on the surface, but it rewards traders who read the story behind the signal. Many beginners treat it as a basic overbought or oversold gauge. Experienced Forex traders tend to use it with more nuance: as a momentum lens, an entry-timing filter, a divergence tool, and a warning that a move may already have spent most of its usable energy.
This guide explains how Stochastic works, how to read it in live Forex conditions, which strategies are actually practical, where traders usually get trapped, and how to build a checklist before putting capital at risk.
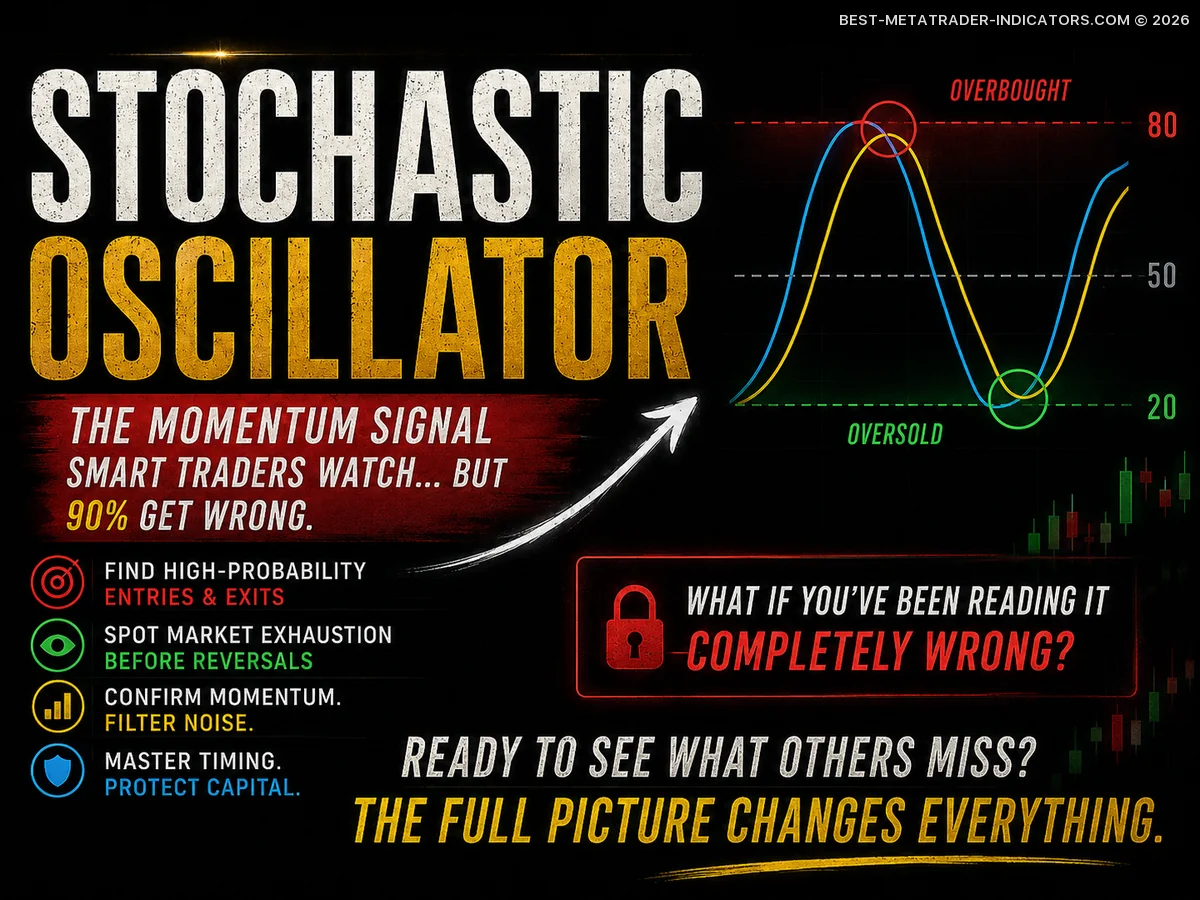
📌 What Is the Stochastic Oscillator?
The Stochastic Oscillator is a momentum indicator that compares the current closing price of a currency pair to its recent price range over a selected number of periods. The logic is straightforward: during strong upward momentum, price often closes near the top of its recent range; during strong downward momentum, it tends to close near the bottom.
The indicator usually consists of two lines:
- %K line: the faster line, reacting quickly to changes in price movement.
- %D line: the slower signal line, usually calculated as a moving average of %K.
Trader’s note: Stochastic does not tell you whether a currency pair is “cheap” or “expensive.” It tells you where the current close sits inside a recent price range. That distinction matters because a pair can stay overbought in a strong uptrend or oversold in a strong downtrend for longer than impatient traders expect.
👀 What Are Pro Traders Seeing That You’re Missing?


⚙️ How Stochastic Is Usually Interpreted
Most charting platforms display Stochastic between 0 and 100. The common reference zones are:
| Stochastic Zone | Common Meaning | Professional Interpretation |
|---|---|---|
| Above 80 | Overbought | Momentum is strong, but the move may be mature. Never sell this reading blindly. |
| Below 20 | Oversold | Momentum is weak, but the decline may be stretched. Never buy this reading blindly. |
| 50 area | Momentum midpoint | Useful as a bias filter. Above 50 leans bullish; below 50 leans bearish. |
| Crossovers | Potential signal | Stronger when aligned with trend direction, support/resistance, and clean price structure. |
🧠 The Biggest Mistake: Selling Overbought and Buying Oversold
The most dangerous beginner mistake is treating the 80 and 20 levels as automatic reversal zones. In Forex, strong trends often remain overbought or oversold while price continues moving aggressively. Selling every reading above 80 in a strong bullish trend is not a strategy; it is guessing against active momentum.
Important: Overbought does not mean “sell now.” Oversold does not mean “buy now.” These zones only tell you that momentum is stretched relative to the recent range. You still need price confirmation.
📈 Strategy 1: Stochastic Trend Pullback
This is one of the most practical ways to use Stochastic in Forex. Instead of fighting the dominant move, you use the indicator to time pullbacks inside that move.
Setup Rules
- Identify the main trend using price structure, a moving average, or higher-timeframe direction.
- In an uptrend, wait for Stochastic to fall toward or below 20.
- Look for price to hold a higher low, support zone, trendline, or moving-average area.
- Enter only after bullish confirmation, such as a strong candle close, break of minor structure, or %K crossing above %D.
- Place the stop below the pullback low, not randomly below the entry candle.
For short trades, reverse the logic: in a downtrend, wait for Stochastic to rise toward or above 80, then look for bearish confirmation near resistance or a failed retest.
🔄 Strategy 2: Stochastic Crossover With Market Structure
A Stochastic crossover happens when the faster %K line crosses the slower %D line. On its own, this can create far too many signals. The quality improves when the crossover appears at a meaningful chart level.
Bullish Crossover
A bullish crossover is more useful when it forms near support, after a controlled pullback, or after price rejects a lower level. The best signals usually appear when price action and momentum turn together.
Bearish Crossover
A bearish crossover becomes more relevant near resistance, after a failed breakout, or when price forms a lower high. It is strongest when the larger trend also points down.
📉 Strategy 3: Stochastic Divergence
Divergence appears when price and momentum disagree. It can warn that the current move is losing strength, but it should not be treated as a standalone entry trigger.
| Divergence Type | What Price Does | What Stochastic Does | Potential Message |
|---|---|---|---|
| Bullish Divergence | Makes a lower low | Makes a higher low | Selling pressure may be weakening. |
| Bearish Divergence | Makes a higher high | Makes a lower high | Buying pressure may be fading. |
| Hidden Bullish Divergence | Makes a higher low | Makes a lower low | Trend continuation may be forming. |
| Hidden Bearish Divergence | Makes a lower high | Makes a higher high | Downtrend continuation may be forming. |
Pro tip: Divergence works best when it appears at important support or resistance, after an extended move, or near a higher-timeframe supply or demand area. Divergence in the middle of a messy range is usually noise.
🧩 Strategy 4: Multi-Timeframe Stochastic Alignment
A clean way to reduce false signals is to use one timeframe for direction and another for entry timing. For example, a trader may use the 4-hour chart to define the main direction and the 15-minute or 1-hour chart to time the actual entry.
Example Workflow
- Check the higher timeframe first.
- If the higher timeframe trend is bullish, look mainly for long setups.
- Wait for the lower timeframe Stochastic to become oversold during a pullback.
- Confirm the entry with price action, structure, or a liquidity sweep.
- Manage the trade using the higher-timeframe context, not the emotion of the current candle.
🎯 Professional MT4 & MT5 Indicators with Accurate Signals
⏱️ Best Stochastic Settings for Forex
The classic setting is often 14, 3, 3, but there is no universal “best” setting. The right setting depends on the pair, timeframe, volatility, and trading style.
Stochastic settings should match the trader’s objective: fast timing, balanced signals, or smoother confirmation.
| Setting | Best For | Strength | Weakness |
|---|---|---|---|
| 5, 3, 3Fast Stochastic | Scalping and quick reactions | Early signals | More false signals |
| 14, 3, 3Classic Stochastic | General Forex trading | Balanced response | Still requires filtering |
| 21, 5, 5Smoother Stochastic | Swing trading | Cleaner signals | Later entries |
✅ Practical Stochastic Trading Checklist
Before taking a Stochastic-based trade, run through this checklist. It helps filter out impulsive entries and low-quality signals.
- Is the market trending, ranging, or breaking out?
- Does the Stochastic signal match the higher-timeframe direction?
- Is price near support, resistance, supply, demand, or a key moving average?
- Is there confirmation from candles or market structure?
- Is the stop-loss placed beyond a logical invalidation point?
- Is the potential reward at least reasonable compared with the risk?
- Is there unusual spread expansion or disorderly volatility that could distort the setup?
- Are you entering because of a plan, not because you fear missing out?
🧪 Stochastic in Trending vs Ranging Markets
The Stochastic Oscillator behaves differently depending on the market condition. Understanding that shift is more useful than memorizing signals.
| Market Type | How Stochastic Often Behaves | Better Approach |
|---|---|---|
| Strong Uptrend | Can stay above 80 repeatedly | Use oversold pullbacks for potential longs. |
| Strong Downtrend | Can stay below 20 repeatedly | Use overbought rallies for potential shorts. |
| Sideways Range | Moves between overbought and oversold more cleanly | Use support/resistance boundaries with confirmation. |
| Disorderly Volatility | Signals can become less reliable | Reduce size, wait, or avoid trading until spreads and candle behavior normalize. |
⚖️ Advantages and Disadvantages
Advantages
- Easy to read and available on most platforms.
- Helpful for spotting momentum shifts.
- Useful for timing pullbacks in trends.
- Can reveal divergence before price turns.
- Works across many Forex pairs and timeframes.
Disadvantages
- Can generate many false signals in strong trends.
- Overbought and oversold readings are often misunderstood.
- Needs confirmation from price action or structure.
- Very fast settings can encourage overtrading.
- Less reliable during sharp, disorderly volatility spikes.
💡 Professional Tips for Better Results
Trade Location First
A Stochastic signal at a random chart level is weak. A signal at support, resistance, or a higher-timeframe zone carries far more weight.
Respect Trend Strength
When the trend is strong, use Stochastic for pullbacks, not for guessing tops and bottoms.
Watch the Close
Do not react too early while the candle is still forming. A signal can disappear before the candle closes.
🛠️ A Simple Stochastic Trading Plan
Here is a simple framework traders can adapt and test. It is not a guaranteed system, but it creates structure and removes a lot of guesswork.
Long Setup Example
- Higher timeframe shows bullish structure.
- Price pulls back into support or a previous breakout area.
- Stochastic drops below 20 and then crosses upward.
- A bullish candle closes above short-term resistance.
- Stop-loss goes below the pullback low.
- Take-profit is planned near the next resistance or based on a fixed reward-to-risk target.
Short Setup Example
- Higher timeframe shows bearish structure.
- Price rallies into resistance or a previous breakdown area.
- Stochastic rises above 80 and then crosses downward.
- A bearish candle closes below short-term support.
- Stop-loss goes above the pullback high.
- Take-profit is planned near the next support or based on a fixed reward-to-risk target.
🚫 When Not to Use Stochastic
No indicator works in every condition. Sometimes the cleanest trade is no trade.
- Avoid relying on Stochastic alone during unstable liquidity or abnormal spread conditions.
- Avoid taking every crossover in a choppy market.
- Avoid countertrend entries when the higher timeframe is moving aggressively.
- Avoid changing settings after every losing trade.
- Avoid trading without a predefined stop-loss and exit plan.
📊 Stochastic vs RSI vs MACD
Stochastic is often compared with RSI and MACD. Each tool reads momentum differently, so the best choice depends on your trading style.
Momentum indicators are not competitors; they are tools. The better traders know which tool fits which market condition.
| Indicator | Main Focus | Best Use | Common Mistake |
|---|---|---|---|
| StochasticRange position momentum | Close relative to recent high-low range | Pullbacks, timing, divergence | Buying/selling overbought and oversold blindly |
| RSIRelative strength | Speed and magnitude of price changes | Trend strength, divergence, momentum regimes | Assuming 70/30 always means reversal |
| MACDMoving average momentum | Relationship between moving averages | Trend confirmation and momentum shifts | Entering too late after the move is extended |
📝 Risk Management Notes
Risk management is not optional. A good Stochastic signal can still fail. Every trade needs a clear invalidation point, controlled position size, and a defined exit plan. The purpose of an indicator is to support decision-making, not to remove uncertainty.
Consider risking a small, fixed percentage per trade and avoid increasing position size after losses. The Stochastic Oscillator can improve timing, but it cannot protect an account from poor discipline.
📈 Better Signals. Faster Decisions. Stronger Trades.
❓ Frequently Asked Questions About Stochastic
Is Stochastic good for Forex trading?
Yes, it can be useful in Forex, especially for pullback timing, range trading, and divergence analysis. However, it should be combined with market structure, trend direction, and risk management.
What is the best Stochastic setting?
The classic 14, 3, 3 setting is a balanced starting point. Scalpers may prefer faster settings, while swing traders may prefer smoother settings such as 21, 5, 5.
Should I sell when Stochastic is above 80?
Not automatically. Above 80 means strong momentum or a stretched move. In a strong uptrend, it can remain above 80 while price continues rising.
Should I buy when Stochastic is below 20?
Not automatically. Below 20 can warn that price is stretched, but in a strong downtrend the market can remain oversold while continuing lower.
Is Stochastic better than RSI?
Neither is universally better. Stochastic is often more sensitive and can be useful for timing. RSI is often used to judge broader momentum strength. Many traders test both and choose based on their strategy.
Can Stochastic be used for scalping?
Yes, but fast signals can create noise. Scalpers should use strict filters, avoid erratic volatility spikes, and control risk carefully.
🏁 Final Thoughts
The Stochastic Oscillator is powerful when it is used with context. It can help identify pullbacks, exhaustion, divergence, and momentum shifts, but it should never replace a complete trading plan.
The real edge is not in the indicator itself. The edge comes from knowing when to trust the signal, when to ignore it, and how to manage risk when the market proves your idea wrong.
Disclaimer: This article is for educational purposes only and does not constitute financial advice. Forex and CFD trading involve significant risk, and every trader is responsible for testing ideas, managing position size, and accepting the possibility of loss before entering the market.
📌 Great Indicators and Trading Systems for MT4 or MT5
- Top-Rated MetaTrader Indicators


- Stochastic Threads Indicator

- The Hidden MACD Indicator…

- Mastering the SuperTrend…

- Stochastic Cycle Indicator

- Best Hedge Fund Indicator…

- Profitable Forex Indicator:…

- Stochastic Custom Indicator

- COG MACD Stochastic Indicator

- Supply and Demand Indicator:…

- Footprint Indicator: The…

- Trend Following Indicator…

- Double Stochastic Indicator

- Stochastic Elasticity Indicator

- Stochastic ROC Indicator

- Swami Stochastic Indicator

- Color Zerolag Stochs Indicator

- Triple Stochastic Indicator

- Stochastic Cross Alert Indicator

- All Stochastics Indicator

- Order Block Indicator Secrets…

- Non-Repainting Non-Lagging Indicators