Moving Average (MA) is one of the most widely used indicators in Forex trading because it turns noisy price action into a cleaner visual story. It does not predict the future, and it does not magically know where EUR/USD, GBP/JPY or XAU/USD will go next. What it does extremely well is help traders answer three practical questions: Is the market trending? Where is the average value area? And is momentum shifting?
After more than two decades of watching traders overcomplicate simple ideas, one lesson stands out: the moving average is powerful only when it is used with context. Used alone, it can be late, noisy or misleading. Used with structure, risk management, price action and market regime, it becomes a reliable decision filter.
📌 What Is a Moving Average?
A Moving Average is a line that shows the average price of a currency pair over a selected number of periods. For example, a 20-period moving average on the daily chart shows the average closing price of the last 20 trading days. On the 1-hour chart, it shows the average of the last 20 hourly candles.
The key word is moving. With every new candle, the oldest price drops out of the calculation and the newest price is added. This creates a smooth line that follows price and helps traders see the broader direction more clearly.
Trader’s note: A moving average is a lagging indicator. That is not a weakness by itself. Lag can be useful because it filters out emotional reactions to every single candle. The goal is not to catch every top or bottom; the goal is to make better decisions with less noise.
🎯 Pro Indicators Created for Precision, Timing & Momentum


🧠 Why Forex Traders Use Moving Averages
Forex markets can move fast, especially around session opens, liquidity shifts and sharp volatility expansions. A moving average helps bring order to that movement. Instead of asking, “What do I feel about this chart?”, a trader can ask, “Where is price in relation to its average, and is the slope supporting the trade idea?”
📈 Trend Direction
If price stays above a rising moving average, buyers are generally in control. If price stays below a falling moving average, sellers usually dominate.
🧲 Dynamic Support & Resistance
In trending markets, price often pulls back toward a moving average before continuing in the trend direction.
🧭 Trade Filtering
Moving averages can help traders avoid low-quality trades by keeping them aligned with the dominant market direction.
⚙️ Main Types of Moving Averages
Not every moving average reacts the same way. Some are smoother and slower. Others are faster and more sensitive. Choosing the right type depends on your trading style, timeframe and the purpose of the indicator.
| Type | What It Does | Best Use | Main Weakness |
|---|---|---|---|
| SMA Simple Moving Average | Calculates the equal average of selected prices. | Trend filtering, higher timeframe structure, clean analysis. | Can react slowly to sudden market shifts. |
| EMA Exponential Moving Average | Gives more weight to recent prices. | Intraday trading, pullback entries, momentum tracking. | Can create more false signals in choppy markets. |
| WMA Weighted Moving Average | Weights recent candles more heavily than older candles. | Short-term reaction and active trade management. | Less commonly used and may be too sensitive for beginners. |
| SMMA Smoothed Moving Average | Creates a very smooth average line. | Longer-term trend reading and market bias. | Can lag significantly during fast reversals. |
📊 SMA vs EMA: Which One Is Better?
The honest answer: neither is automatically better. The SMA is cleaner and smoother, while the EMA reacts faster. A swing trader may prefer the SMA for market structure. A day trader may prefer the EMA for quicker feedback. The best choice is the one that fits your trading plan and can be tested consistently.
Use this comparison as a practical decision guide, not as a fixed rule.
| Factor | SMA | EMA |
|---|---|---|
| SpeedHow quickly it reacts | Slower and smoother | Faster and more sensitive |
| Best forCommon trading use | Trend bias and higher timeframe analysis | Entries, pullbacks and momentum shifts |
| False signalsDuring sideways markets | Usually fewer, but later | Usually more, but earlier |
| Beginner friendlyEase of interpretation | Very beginner friendly | Good, but requires more discipline |
⏱️ Popular Moving Average Settings
There is no magical setting. A 20 EMA is not better simply because it appears on many charts. A 200 SMA is not powerful because of some hidden property. These settings matter because they create consistent reference points across different trading styles and are easy to test in MetaTrader, TradingView or any platform that supports standard moving averages.
⚡ Short-Term MAs
- 5 MA: very fast, often used by scalpers.
- 9 EMA: popular for short-term momentum.
- 10 EMA: useful for aggressive pullback trading.
- 20 EMA: common trend and pullback guide.
🧱 Medium & Long-Term MAs
- 50 SMA/EMA: medium-term trend direction.
- 100 SMA: broader trend confirmation.
- 200 SMA: major long-term market bias.
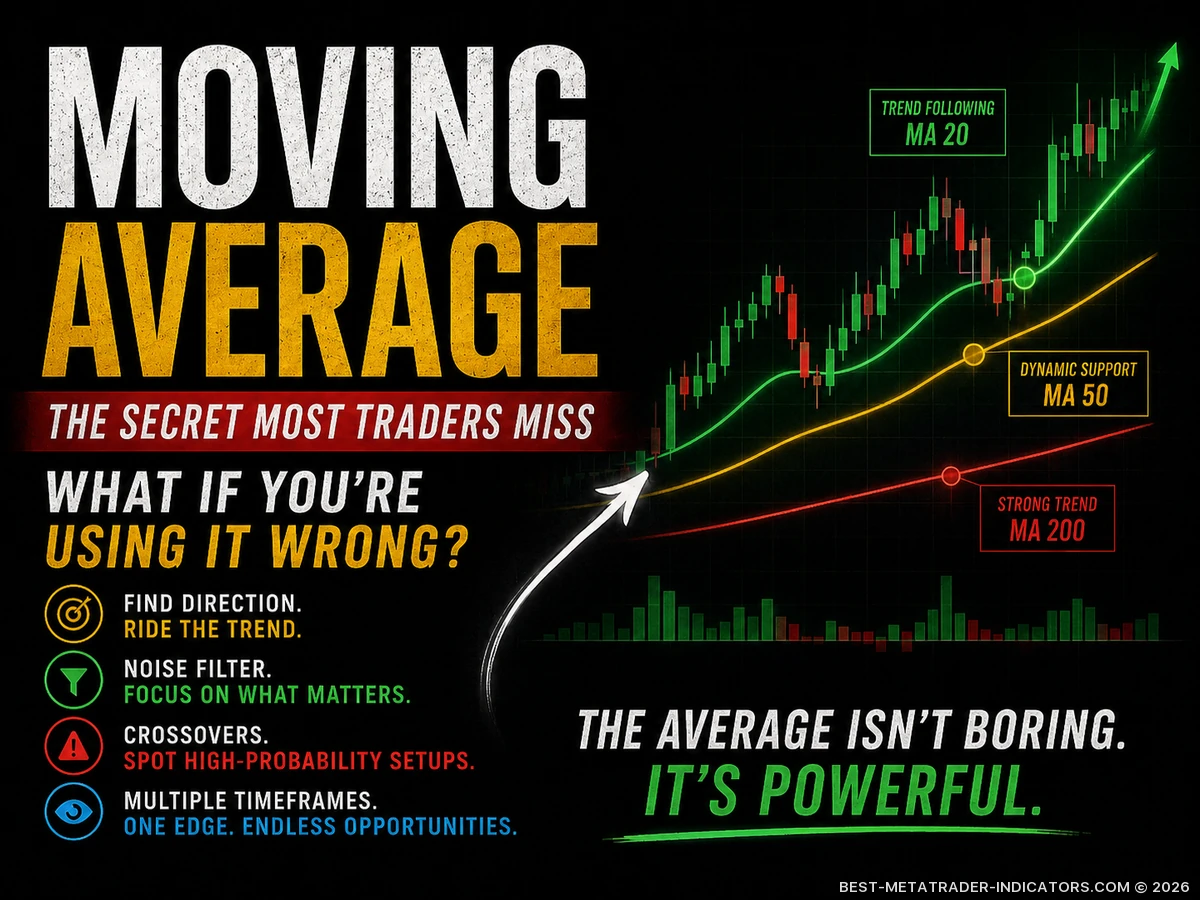
- 20/50/200 combination: multi-layer trend reading.
Important: Do not keep changing your MA settings after every losing trade. That is curve-fitting. Pick settings that match your timeframe, test them, document them and judge them over a sample of many trades.
📈 Strategy 1: Trend Filter With the 200 Moving Average
The 200 MA is often used as a long-term trend filter. The concept is simple: if price is above the 200 MA, you mainly look for buy setups. If price is below the 200 MA, you mainly look for sell setups. This does not mean every buy above the 200 MA is a good trade. It simply keeps you from fighting the bigger flow too often.
📋 Basic Rules
- Choose a timeframe that matches your style, such as H1, H4 or Daily.
- Plot the 200 SMA or 200 EMA.
- When price is above the MA and the MA is rising, focus on long setups.
- When price is below the MA and the MA is falling, focus on short setups.
- Use support/resistance, candlestick confirmation or market structure for entries.
This strategy works best in trending markets. It performs poorly when price is moving sideways around the moving average. That is why market regime matters.
🔁 Strategy 2: Moving Average Pullback
One of the most practical ways to use a moving average is to wait for price to pull back toward it during a trend. Many traders lose money because they chase candles after the move has already happened. A pullback strategy forces patience.
🟢 Bullish Pullback Idea
- Price is above the 50 MA.
- The MA is rising.
- Price pulls back toward the MA.
- A bullish rejection candle appears near the MA.
- Entry is considered only after confirmation, not before.
🟠 Bearish Pullback Idea
- Price is below the 50 MA.
- The MA is falling.
- Price rallies back toward the MA.
- A bearish rejection candle appears near the MA.
- Entry is considered only if risk/reward still makes sense.
Professional tip: The best pullbacks often look uncomfortable. They shake out weak traders, test patience and then continue in the original trend. Your job is not to predict every pullback; your job is to define which pullbacks are worth risking money on.
✂️ Strategy 3: Moving Average Crossover
A moving average crossover happens when a faster MA crosses above or below a slower MA. For example, a 20 EMA crossing above a 50 EMA can suggest improving bullish momentum. A 20 EMA crossing below a 50 EMA can suggest bearish momentum.
| Crossover | Possible Meaning | How to Improve It |
|---|---|---|
| Fast MA crosses above slow MA | Buyers may be gaining control. | Confirm with higher highs, higher lows or breakout structure. |
| Fast MA crosses below slow MA | Sellers may be gaining control. | Confirm with lower highs, lower lows or resistance rejection. |
| Repeated crossing | Market may be ranging or indecisive. | Avoid trend strategies until price breaks out clearly. |
Crossover systems can be useful, but they are often late. By the time the cross appears, a large part of the move may already be gone. For that reason, many experienced traders use crossovers as confirmation, not as blind entry signals.
🧩 Strategy 4: Moving Average + Market Structure
This is where moving averages become much more useful. Instead of trading every touch or every cross, combine the MA with market structure. Ask: Is the market making higher highs and higher lows? Is it making lower highs and lower lows? Is price breaking key levels or rejecting them?
Simple framework: Use the moving average to define the environment, then use market structure to define the trade. The MA answers “trend or no trend?” Price action answers “where is the actual setup?”
⚡ Powerful Trading Features Designed for Smarter Decisions
🛡️ Risk Management With Moving Averages
A moving average can help with trade management, but it should never replace proper risk control. The most beautiful MA setup can still lose. A professional trader thinks first about risk, then about profit.
🛑 Stop-Loss Ideas
- Place stops beyond the recent swing high or swing low.
- Avoid placing stops directly on the MA where noise can trigger them.
- Use volatility, spread and session timing when calculating stop distance.
- Never increase position size simply because a setup “looks perfect”.
🎯 Take-Profit Ideas
- Target previous support or resistance zones.
- Use partial profits when price reaches logical reaction areas.
- Trail behind a moving average only in strong trending conditions.
- Do not force a fixed target if the market structure says otherwise.
✅ Moving Average Trading Checklist
Before entering a trade based on a moving average, run through this checklist. It can prevent many emotional and low-quality trades.
✅ Pre-Trade Checklist
- Is the market trending or ranging?
- Is price above or below the key moving average?
- Is the moving average rising, falling or flat?
- Does the setup align with higher timeframe direction?
- Is there a clear support or resistance level nearby?
- Is the entry based on confirmation or only hope?
- Is the stop-loss placed logically?
- Is the potential reward at least worth the risk?
- Are there volatility conditions that could distort the setup?
- Would you still take this trade if you had just lost the previous one?
👍 Advantages of Moving Averages
Clear Trend Reading
Moving averages make it easier to see whether buyers or sellers are generally controlling the market.
Simple and Flexible
They can be used by scalpers, day traders, swing traders and position traders across almost all currency pairs.
Good Trade Filter
They help reduce impulsive counter-trend trades and give structure to decision-making.
Works With Other Tools
MAs combine well with support/resistance, price action, Fibonacci, RSI, MACD and volume-related analysis.
👎 Disadvantages of Moving Averages
Lagging Signals
Because they are based on past prices, moving averages often react after a move has already started.
Weak in Ranges
In sideways markets, price can cross the MA repeatedly and create many false signals.
Over-Optimization Risk
Changing settings too often can create the illusion of improvement without real trading edge.
No Standalone Edge
A moving average by itself does not include risk, context, liquidity, volatility conditions or market structure.
💡 Practical Tips From Experience
Moving averages look simple, but the discipline around them is what separates useful analysis from random trading. Here are practical lessons that can save time, money and frustration.
- Use fewer lines: Too many moving averages can turn a clean chart into visual confusion.
- Respect flat MAs: A flat moving average often warns that the market has no clear trend.
- Watch the slope: The angle of the MA can be more useful than the exact touch.
- Do not chase: If price is far away from the MA, the trade may already be extended.
- Combine timeframes: Use a higher timeframe MA for bias and a lower timeframe for entry timing.
- Journal every setup: Track which MA setups work best for each pair and session.
🧭 Best Timeframes for Moving Averages
The same moving average can behave very differently depending on timeframe. A 20 EMA on M5 is fast and noisy. A 20 EMA on D1 is much smoother and more meaningful for swing traders. Always match the tool to the mission.
| Trader Type | Useful Timeframes | Common MA Approach |
|---|---|---|
| Scalper | M1, M5, M15 | Fast EMAs such as 9, 10 or 20 for momentum and quick pullbacks. |
| Day Trader | M15, M30, H1 | 20 EMA and 50 EMA for intraday trend and pullback structure. |
| Swing Trader | H4, Daily | 50 SMA/EMA and 200 SMA for broader market bias. |
| Position Trader | Daily, Weekly | 100 and 200 period averages for long-term trend context. |
🚫 Common Mistakes Beginners Make
The problem is usually not the moving average. The problem is how traders use it. Avoid these common mistakes:
- Buying only because price touched a moving average.
- Selling only because price crossed below a moving average.
- Using the same settings on every pair without testing.
- Ignoring spread, volatility expansion and poor execution conditions.
- Trading MA crossovers in a sideways market.
- Moving the stop-loss because the moving average “might still hold”.
- Thinking a moving average can replace a complete trading plan.
🧪 Example Trading Plan Using Moving Averages
Here is a simple example of how a trader could build a structured MA-based plan. This is not financial advice; it is a framework that should be tested on historical charts and demo conditions before real-money trading.
🧪 Sample Plan: H1 Trend Pullback
- Market: Major Forex pairs only, such as EUR/USD, GBP/USD, USD/JPY and AUD/USD.
- Timeframe: H1 for setup, H4 for directional bias.
- Indicators: 20 EMA, 50 EMA and 200 SMA.
- Bias: Buy only when price is above the 200 SMA and the 20 EMA is above the 50 EMA.
- Entry: Wait for a pullback toward the 20 or 50 EMA, then look for bullish price action.
- Stop: Below the recent swing low, not directly on the MA.
- Target: Previous high, resistance zone or at least a planned risk/reward level.
- No trade: Avoid entries when volatility is erratic or when the MAs are flat and tangled.
📚 Moving Average Ideas for Different Market Conditions
| Market Condition | What the MA Often Shows | Better Trader Response |
|---|---|---|
| Strong uptrend | Price remains above a rising MA. | Look for pullbacks, not random shorts. |
| Strong downtrend | Price remains below a falling MA. | Look for rallies into resistance, not emotional buys. |
| Range | MA becomes flat and price crosses repeatedly. | Avoid trend strategies or switch to range logic. |
| Breakout | Price expands away from the MA with momentum. | Wait for retest or controlled pullback if risk is too wide. |
| Reversal | Price breaks the MA, then structure starts to shift. | Confirm with swing structure before assuming a new trend. |
🚀 Built for Traders Who Need Faster Market Confirmation
❓ Moving Average FAQs
What is the best moving average for Forex?
There is no universal best MA. Many traders use the 20 EMA, 50 MA and 200 MA because they provide useful short, medium and long-term context.
Is EMA better than SMA?
EMA reacts faster, while SMA is smoother. EMA may suit active traders, while SMA may suit traders who prefer cleaner trend analysis.
Can I trade only with moving averages?
You can, but it is usually not ideal. Moving averages work better when combined with market structure, support/resistance and risk management.
Does the 200 MA really matter?
It matters because many traders use it as a long-term trend reference. However, it should still be used with price structure, slope and risk context.
Why do moving averages fail?
They often fail in sideways markets, during sudden volatility spikes or when traders use them as automatic buy/sell signals without confirmation.
How many moving averages should I use?
Usually two or three are enough. More than that often creates confusion instead of clarity.
🏁 Final Thoughts
The Moving Average is not valuable because it is complicated. It is valuable because it is simple, visual and adaptable. In Forex trading, that simplicity can become a serious advantage when it is combined with patience, risk control and market context.
Use moving averages to define direction, filter trades, identify pullback zones and manage expectations. Do not use them as a shortcut for thinking. A good trader does not ask only, “Did price touch the MA?” A good trader asks, “What does this moving average tell me about the market, and does the full setup justify the risk?”
Trade the context, not the line.
Risk disclaimer: Forex and CFD trading involve a high level of risk and can result in losses. This article is for educational purposes only and does not provide financial advice, investment advice or a signal service. Always test any strategy, use a defined Stop Loss, plan Take Profit levels before entry and risk only capital you can afford to lose.