Submit your review | |
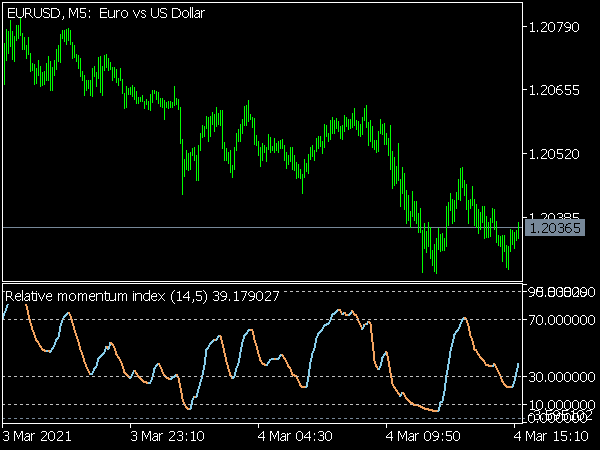
Roger Altman's RMI is calculated by 100 * (RM : (1 + RM)), where RM is the average upward momentum of the last n days divided by the average downward momentum of the last X days. It can initially be used as an oscillator and then resembles the RSI. However, if you use a smaller "X" at the top than at the bottom, you get an interesting trend indicator.
Reaching the extreme zones is therefore considered a signal for the beginning of the trend if the RMI rises above 70 or below 30. As long as it is in the middle range, you do not trade. The indicator runs fairly evenly and usually gives better signals than the ADX. In sideways markets, however, it often indicates trends where there are none, because it runs very easily in extreme zones here.
You can use the RMI as a filter analogous to the ADX. It is also suitable as a trailing stop, so you stay in the market as long as the RMI remains in its extreme range. If we consider the qualities of the RMI as a trend following indicator and compare it with the most commonly used, the MACD, then the MACD often gives the faster signals, but the RMI gives significantly fewer false signals.
Like all trend following indicators, false signals in the RMI mainly occur when trend indicators, such as the ADX, fall. On the other hand, they are very good as long as the ADX is rising or another trend indicator, such as the Fractal Trend Index.
📌 Great Indicators and Trading Systems for MT4 or MT5
- Top-Rated MetaTrader Indicators


- Momentum Cloud Indicator

- Zig Zag Momentum Candle

- Smoother Momentum Stops Indicator

- Polychromatic Momentum…

- Color Zero Lag Momentum OsMA

- Anchored Momentum Oscillator

- Relative Vigor Index

- Intraday Momentum Index

- Smoother Momentum Indicator

- Directional Momentum of EMA

- Corr Momentum Indicator

- Color Zerolag Momentum Indicator

- Blau Candlestick Momentum

- Momentum Ratio Oscillator

- Momentum Candle Sign Indicator

- William Blau Trend Momentum Indicator

- Trade Volume Index Indicator

- Momentum Signal Oscillator

- DSL Synthetic EMA Momentum

- Blau Directional Trend Index Indicator

- Non-Repainting Non-Lagging Indicators