How Bollinger Bands Reveal Market Pressure Before Explosive Forex Breakouts

Advanced Bollinger Bands strategy showing hidden momentum shifts and volatility expansion before major market moves
The market gets quiet before the biggest moves. Bollinger Bands reveal what most traders miss.

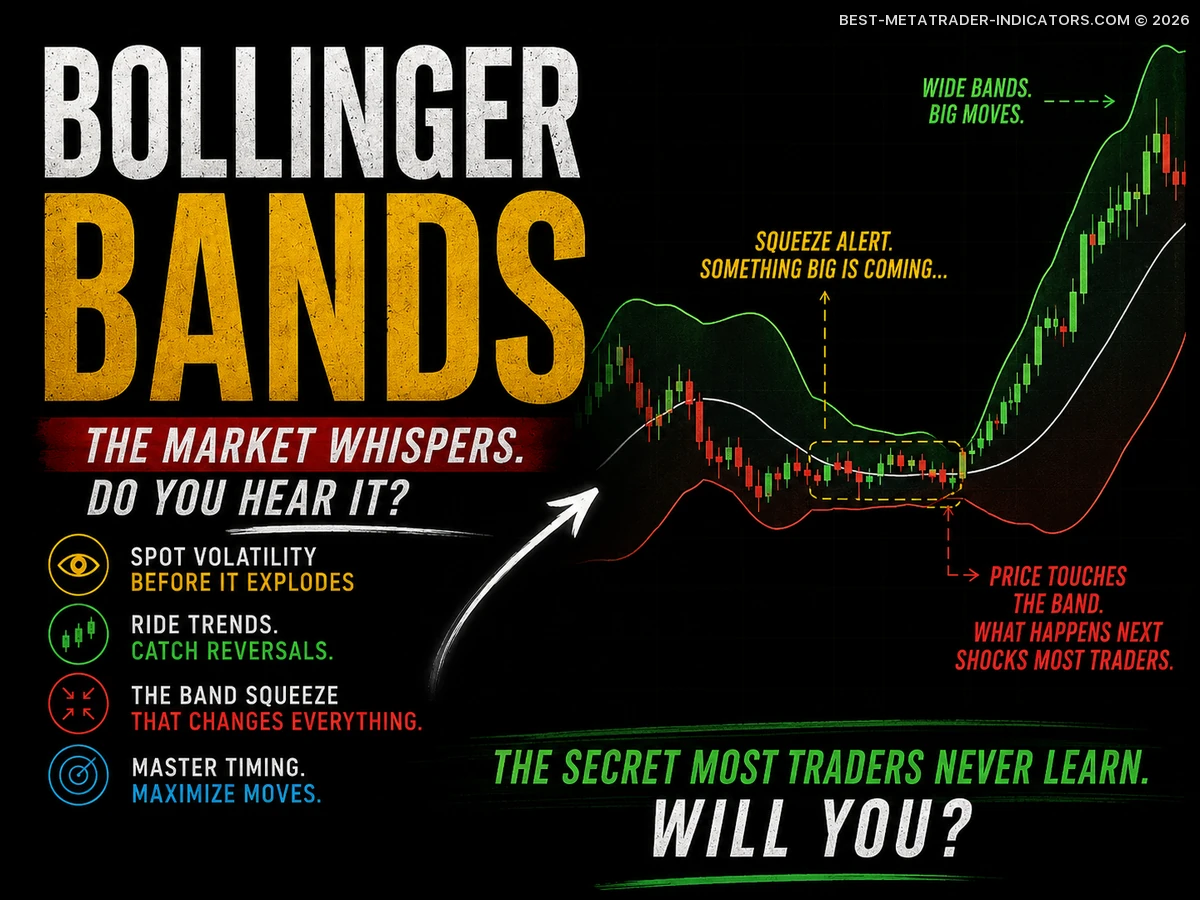
Bollinger Bands are not magic lines. They are a volatility framework. Used well, they can help you understand when a currency pair is quiet, when it is expanding, when price may be stretched, and when the market is simply too messy to trade.

After more than two decades of watching Forex markets move through trending sessions, fake breakouts, volatility spikes and dead ranges, one lesson stands out: the trader who understands volatility usually makes better decisions than the trader who only looks for “buy” or “sell” signals.

This guide explains Bollinger Bands in a practical way: how they work, how to read them, which strategies traders use, what mistakes to avoid, and how to turn the indicator into a repeatable trading checklist.

The Hidden MACD Indicator Patterns Behind Explosive Forex Market Moves

MACD Indicator exposing hidden trend reversals before major Forex breakouts
What if the next big move was already visible inside the MACD?

The Moving Average Convergence Divergence indicator, better known as MACD, is one of the most practical momentum tools in technical trading. It is simple enough for newer traders to read, yet deep enough for experienced chartists to build clear decision frameworks around it.

After years of watching charts move through quiet ranges, volatility bursts, trend days, false breakouts, and tired reversals, I can say this clearly: MACD works best when you stop treating it as a standalone signal and start treating it as a conversation between price, momentum, and market structure.

Many traders open a chart, add MACD, wait for two lines to cross, and expect the setup to take care of itself. That is usually where the frustration starts. The real value of MACD is not the crossover by itself. The value is in understanding where the crossover happens, what price is doing at that moment, whether momentum agrees with the trend, and whether the trade location makes sense.

Mastering RSI in Forex Trading: Signals, Divergence and Market Timing

RSI Indicator analysis showing why the 70 and 30 levels may hide more than simple buy and sell signals
RSI Indicator: why 70 and 30 may not mean what traders expect.

The Relative Strength Index, better known as RSI, is one of the most widely used momentum indicators in trading. But popularity does not make an indicator profitable by itself. Many beginners treat RSI as a simple “buy below 30, sell above 70” tool, then find themselves trapped when price keeps moving against the signal.

After years of watching markets trend, range, fake out, reverse, and punish rushed entries, one point becomes clear: RSI is not a magic signal generator. It is a context tool. Used properly, it can help you judge momentum, timing, trend strength, pullback quality, and market exhaustion. Used blindly, it becomes just another reason to enter too early.

Best Beginner Forex Indicators for Smarter Market Entries

Forex trading indicators for beginners showing trend-following, momentum, trend strength, and volatility tools beside a bullish candlestick chart
Most forex traders overload their charts — these simple indicators may reveal what really matters.

If you are new to forex trading, indicators can feel confusing at first. There are hundreds of tools, colorful lines, signals, arrows, oscillators, dashboards, and scanners. After many years of watching live charts, one lesson becomes very clear: beginners do not need more indicators. They need the right indicators, used with simple rules and a calm decision process.

This guide explains the best forex indicators for beginners, how they work, when to use them, what mistakes to avoid, and how to combine them into practical trading ideas. The goal is not to predict every market move. The goal is to build a clear structure so you can make better trading decisions with less emotional pressure.

The Best Indicator for Beginners Might Not Be What You Think

Forex trading indicator for beginners with clear buy sell zones and momentum signals
Most new traders ignore this simple setup… until they see the results.

What is the best indicator for beginners in Forex trading? After more than two decades of watching new traders win, struggle, reset, and slowly build discipline, my answer has stayed the same: the best beginner indicator is not the most complicated one. It is the tool that helps you read direction, avoid impulsive entries, and repeat the same trading process without second-guessing every candle.

For most beginners, the strongest starting point is the Moving Average, especially the 20 EMA and 50 EMA. Once you can read trend direction with moving averages, you can add one momentum tool such as the RSI and one price-structure framework such as support and resistance.

Why the Best Traders Watch Price Action First

Price Action Indicator revealing hidden liquidity zones and breakout traps on a live forex chart
Most traders chase candles. Few notice the footprint that moves the entire market.

A price action indicator is not just another tool dropped onto a chart. Used well, it becomes a practical way to read market behavior, define high-probability zones, and stop reacting emotionally to every candle. After more than two decades of watching currency pairs move through trends, ranges, false breaks, liquidity sweeps, and impatient retail entries, one lesson still stands: price itself is the first indicator.

In this guide, we will walk through what price action indicators are, how they work on MetaTrader-style charts, which strategies traders can build around them, and how to combine them with stop loss, take profit, trading psychology, and professional risk management.

Trend Following Indicator Techniques Used by Active Traders

Advanced Trend Following Indicator with dynamic trend channels, breakout confirmation, and high-probability continuation signals
Most traders enter too late — this trend-following signal may reveal the move before the crowd reacts.

A trend following indicator is not designed to predict the exact top or bottom of the market. Its real job is far more practical: it helps you stay aligned with the dominant direction, filter out random market noise, and build a repeatable trading process around momentum instead of emotion.

Many traders do not struggle because they cannot find trades. They struggle because they enter too early, exit without a plan, or keep fighting strong trends with emotional counter-trend ideas. A well-used trend following indicator can reduce that confusion by answering one simple question: is the market more likely trending up, trending down, or moving sideways?

Swing Trading Indicator Setups for Trend and Breakout Traders

Professional Forex chart using a Swing Trading Indicator to identify hidden breakout opportunities
The next breakout might appear on this indicator long before price explodes.

Swing trading in Forex is the art of capturing meaningful price moves that may last from a few days to several weeks. Unlike scalping, swing trading does not demand constant screen time. Unlike long-term position trading, it still gives active traders frequent opportunities across major, minor and selected exotic currency pairs.

The right swing trading indicator can make your analysis cleaner, your entries more selective and your risk management more disciplined. After years of watching traders succeed and fail, one truth remains unchanged: indicators are tools, not magic signals. The best results come when indicators confirm price structure, market rhythm and a clear trading plan.