Submit your review | |
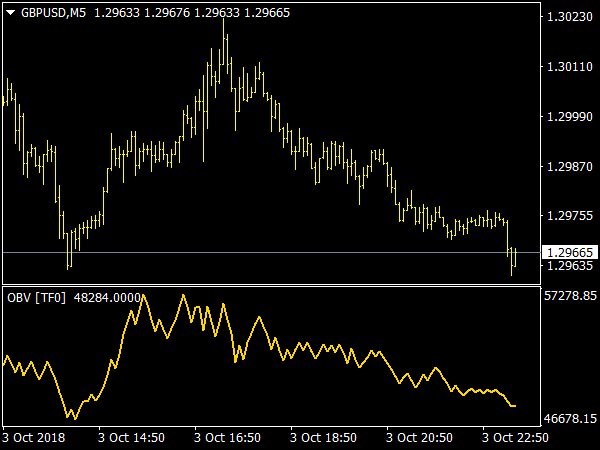
The OBV has come out of the trend somewhat, which has to do with the fact that it often gives signals a little late in the modern dynamic markets. It can then only serve as a trend confirmation. His general interpretation is that the trend is intact as long as the trend of the OBV is also intact.
So you work with trend lines in the indicator and very often breaks show up here rather than in the price. From the idea of its developers Granville, it should be used together with the climax indicator. To do this, calculate the OBV for each share of the Dow Jones and give either the number 1 or -1 or 0 for each share, depending on whether your OBV is decreasing, horizontal or rising.
The OBV on individual stocks gave good signals in the 1970s, in today's markets it also often gives false signals. On the other hand, the OBV is still a very good indicator of the overall market. It is the most popular and by no means the worst indicator of accumulation and distribution. It shapes most patterns, as well as the price, e.g. double bottoms and triangles, the trend lines work particularly well.
As a rule, he has a lead before the price. One should compare the patterns in price and OBV with each other in terms of convergence and divergence, this makes it possible to make a forecast. All this works only in a longer time frame, since the turnover in the course of the day depends on the time of day. In day trading, you have to rely on the data provided by the times and Sales ticker.
The OBV, as well as all other accumulation/distribution indicators, have their greatest forecasting power at new highs and lows that the market makes. If the OBV, for example, makes new highs before the price, you will pay attention to bars that accelerate and get bigger. However, if the price first reaches a new high, one can expect that it will first pause until either the OBV follows, or the whole thing turns into a turnaround.
However, it is different if the price first makes a new low, here it may be that the stock alone drops much more strongly before the crowd realizes this and follows the OBV. But if the OBV first makes a new low, it's time to run out of the market or short it, because this market has lost all its support zones.
The problem with the OBV is that it attributes the entire daily turnover to one page. In long sideways markets, this leads to very bad signals, as a rule, the OBV does not predict the breaks in advance. It also does not work in low-liquid stocks, and in the case of Nasdaq stocks, it is important to ensure that Nasdaq calculates the volume twice, namely once when buying and once when selling.
The basic rule of OBV is that the trend is fine as long as the OBV is setting highs and lows in the same direction as the price. Therefore, it is recommended to work with trend lines also in OBV.
Very important is its use in lateral movements and formations for forecasting the direction of eruption. If more than one monthly turnover has been accumulated in a formation or sideways movement (the average turnover per day is converted to twenty trading days), it can be assumed that the breakout will be upward, unless distribution would then begin in the course of the formation.
Tom DeMark recommends a new indicator that is created when you multiply the OBV by the ROC of the price, i.e. the momentum.
📌 Great Indicators and Trading Systems for MT4 or MT5
- Top-Rated MetaTrader Indicators


- OBV 2.01 MTF Alerts Indicator

- OBV Indicator

- Buy Sell Volume V2 MTF with…

- Volume Swings & Support…

- Bull Bear Balance Indicator

- Marney Volume Range Indicators

- Positive Negative Volume

- Support and Resistance MTF Indicator

- Price Volume Trend MTF noSG

- Waddah Attar Explosion Volume

- OBV Trend Indicator

- OBV MA Histo MTF Arrows Alerts

- Balance Positons Indicator

- Uni Volume Delta Indicator

- Future Volume System

- Volume HTF Indicator

- Account Balance Margin Indicator

- ADX Applied to OBV Indicator

- Volume OCLH MTF Indicator

- ADX of OBV Indicator

- Non-Repainting Non-Lagging Indicators