🌥️ Why Ichimoku Still Matters in Forex
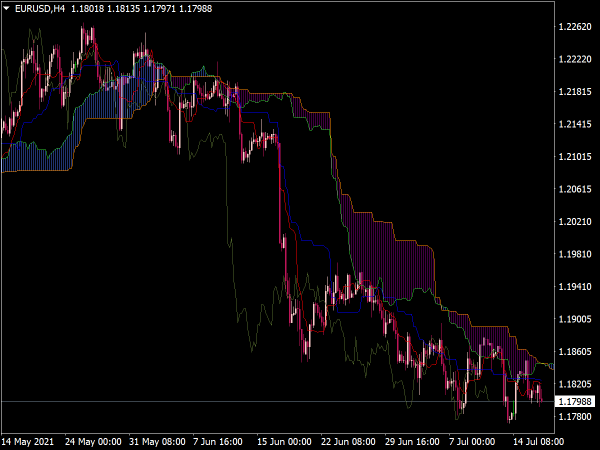
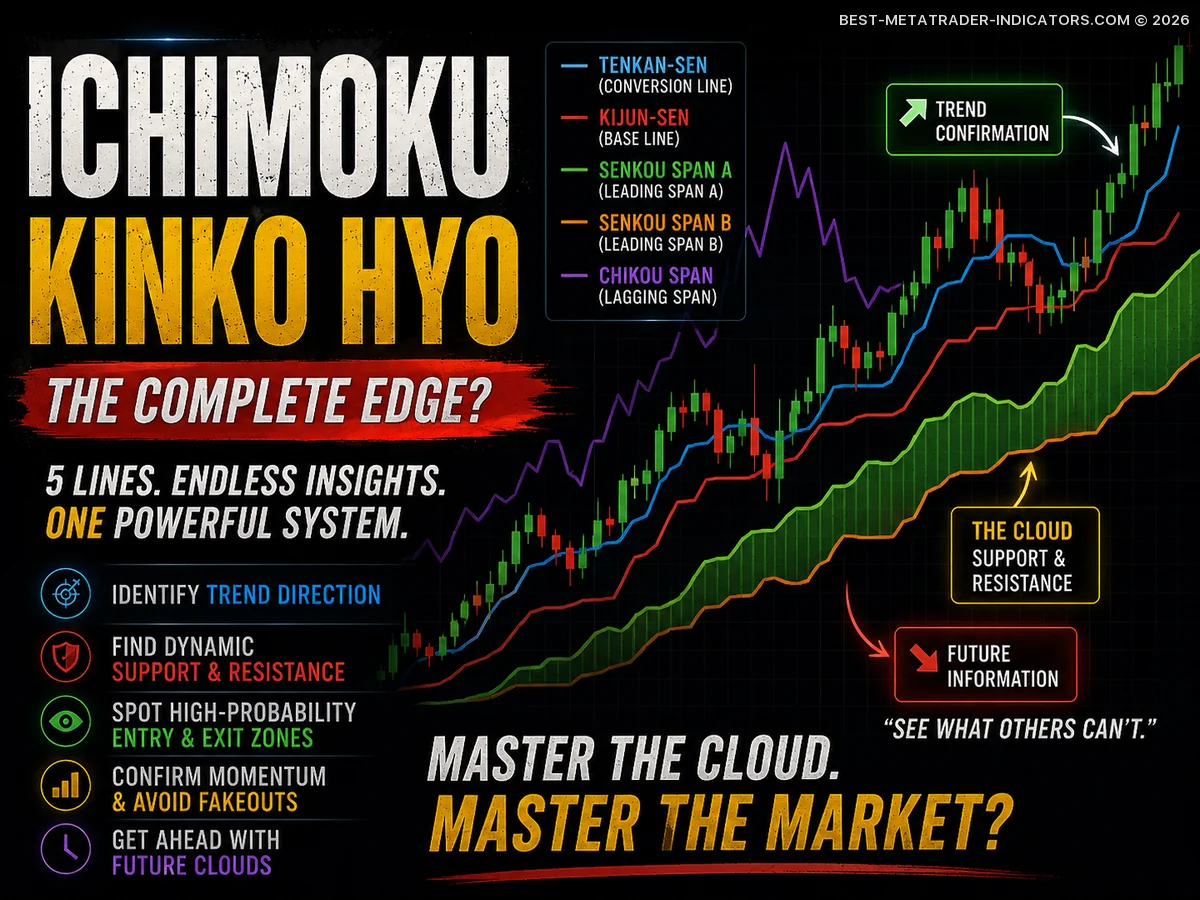
Ichimoku Kinko Hyo is one of the few technical analysis systems that can give a trader a complete market view in one chart. Instead of asking only “is price going up or down?”, Ichimoku asks a better question: is the market in balance, trending, or becoming vulnerable?
The name is often translated as “one glance equilibrium chart”. That is exactly the point. A good Ichimoku setup should let you assess the trend, momentum, key support and resistance zones, and the quality of a possible trade without adding five different indicators on top of each other.
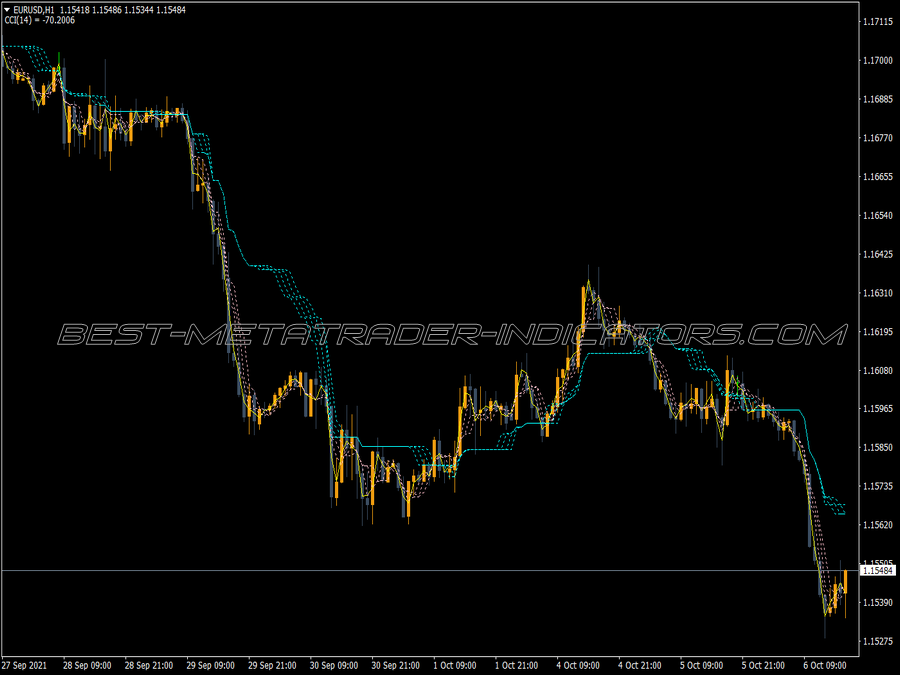
In Forex, where price can move from quiet Asian-session ranges to aggressive active-session breakouts, Ichimoku is valuable because it gives structure. It helps you avoid random entries, late trend chasing, and trades taken directly into hidden resistance.
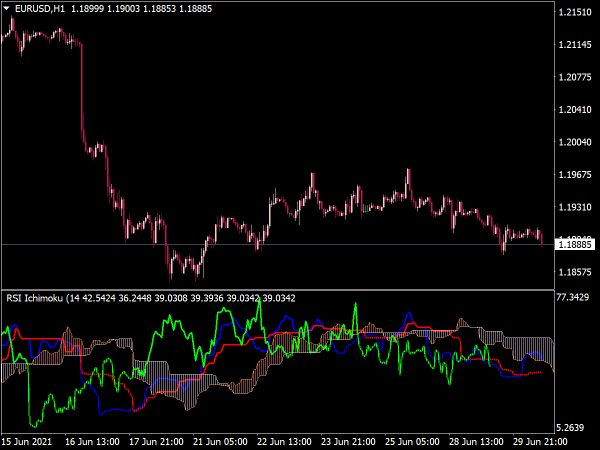
Many beginners see Ichimoku for the first time and think it looks complicated. Five lines, a cloud, forward-shifted levels, and one line pushed into the past can feel overwhelming. But once you understand the role of each component, the system becomes surprisingly logical. This article breaks it down in a practical, trader-friendly way.