Submit your review | |
Support and resistance levels are one of the basic concepts of technical analysis. Many traders look for these levels and apply them in their trading strategy.
Support Level
A support level is a price level where the demand starts rising as the price is going down. Support levels are below the current price levels. As the price declines towards support and gets cheaper, buyers become more inclined to buy and sellers become less inclined to sell. However, once the price has passed this level, by an amount exceeding some noise, it is likely to continue dropping until it finds another support level.
Resistance Level
A resistance level is the opposite of a support level. It is where the demand starts falling as the price is going up. Resistance levels are above the current price levels. As the price rises towards resistance and gets costlier, sellers become more inclined to sell and buyers become less inclined to buy. However, once the price has passed this level, by an amount exceeding some noise, it is likely that it will continue rising until it finds another resistance level.
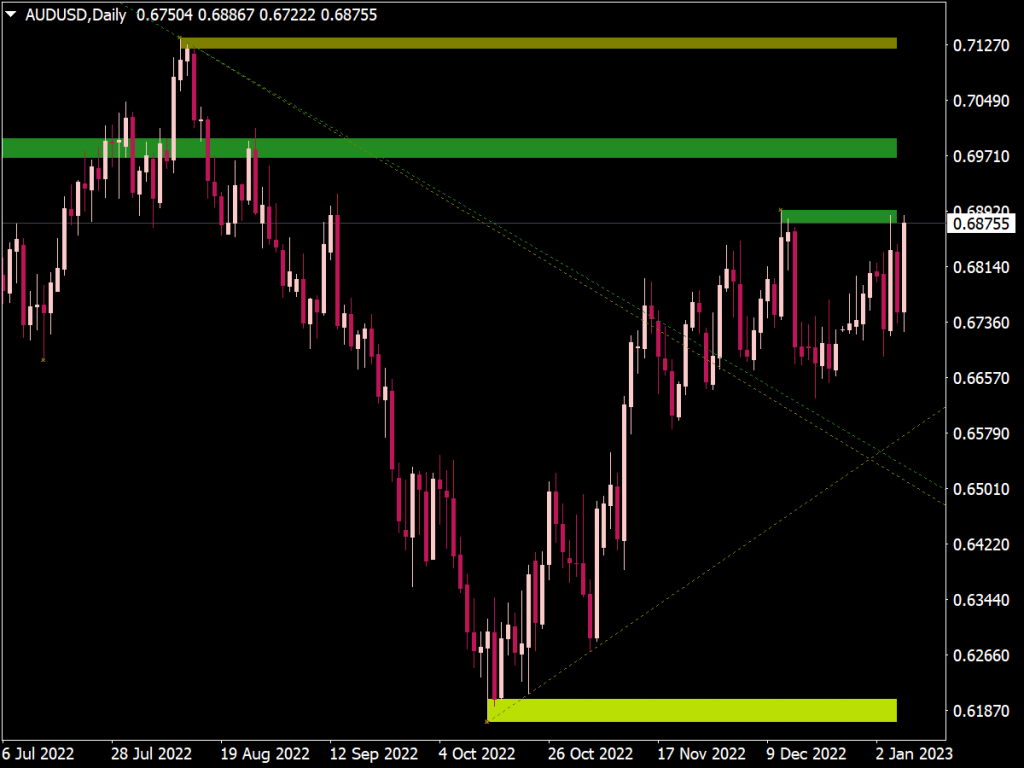
Support and Resistance regions
Always remember that support and resistance levels are not exact price points, they are regions. There are several ways to find support and resistance level, here are some of them:
• Horizontal price levels: these levels can be drawn by connecting previous lows and highs. These levels are also found around round numbers such as 1.2500.
• Trend lines: drawing trend lines is a good way of finding support and resistance levels. Trend lines are drawn by connecting highs and lows in a trend. Trend lines give us rising support and resistance levels.
• Using Fibonacci retracements: support and resistance levels can be identified using Fibonacci retracements, the most popular retracements are 38.2%, 50% and 61.8%.
Fibonacci Retracements
Fibonacci retracement is drawn by taking two extreme points on a chart and dividing the vertical distance by the key Fibonacci ratios. 0.0% is considered to be the start of the retracement, while 100.0% is a complete reversal to the original part of the move. Once these levels are identified, horizontal lines are drawn and used to identify possible support and resistance levels.
Indicator broken...
Just checked, it works fine for me ➡ https://www.best-metatrader-indicators.com/wp-content/uploads/2021/08/ok.png
Would you have an instruction manual on how the Support Resistance Trendlines indicator is used. Any bit of info would be greatly appreciated. Thank you for your indicators.
This indicator is excellent.
I've downloaded "Support and Resistance zones and Trend Lines". It DLL, etc is active but the indicator is not updating. Also: do you have an MQL4 Source code available for this indicator?
Thanks.
This indicator is very useful.
📌 Great Indicators and Trading Systems for MT4 or MT5
- Top-Rated MetaTrader Indicators


- Market Profile with Trend…

- Volume Swings & Support…

- Mtf Support Resistance Indicator

- Four Hour Support Resistance Indicator

- KG Support and Resistance Indicator

- Support Resistance Zones…

- Pivot Resistance Support Indicator

- Support and Resistance…

- Waddah Attar Super Support…

- Support and Resistance Radar V5

- Fractals Support/Resistance…

- MACD Support and Resistance

- Accura Support Resistance Indicator

- Support Resistance Trading Zones

- Support and Resistance SKA

- Support and Resistance…

- Support and Resistance Zone Indicator

- Support and Resistance Button

- Support Resistance Lines Indicator

- Dynamic Trend Support…

- Non-Repainting Non-Lagging Indicators