Liquidity Indicator: Find the Zones Where Big Traders Enter the Market

Institutional liquidity indicator revealing hidden forex pressure zones before major price expansion
The chart whispers before the market explodes.

A liquidity indicator is more than another chart overlay. It acts like a market-reading assistant, helping you understand where larger participants may be searching for orders before price commits to its real move.

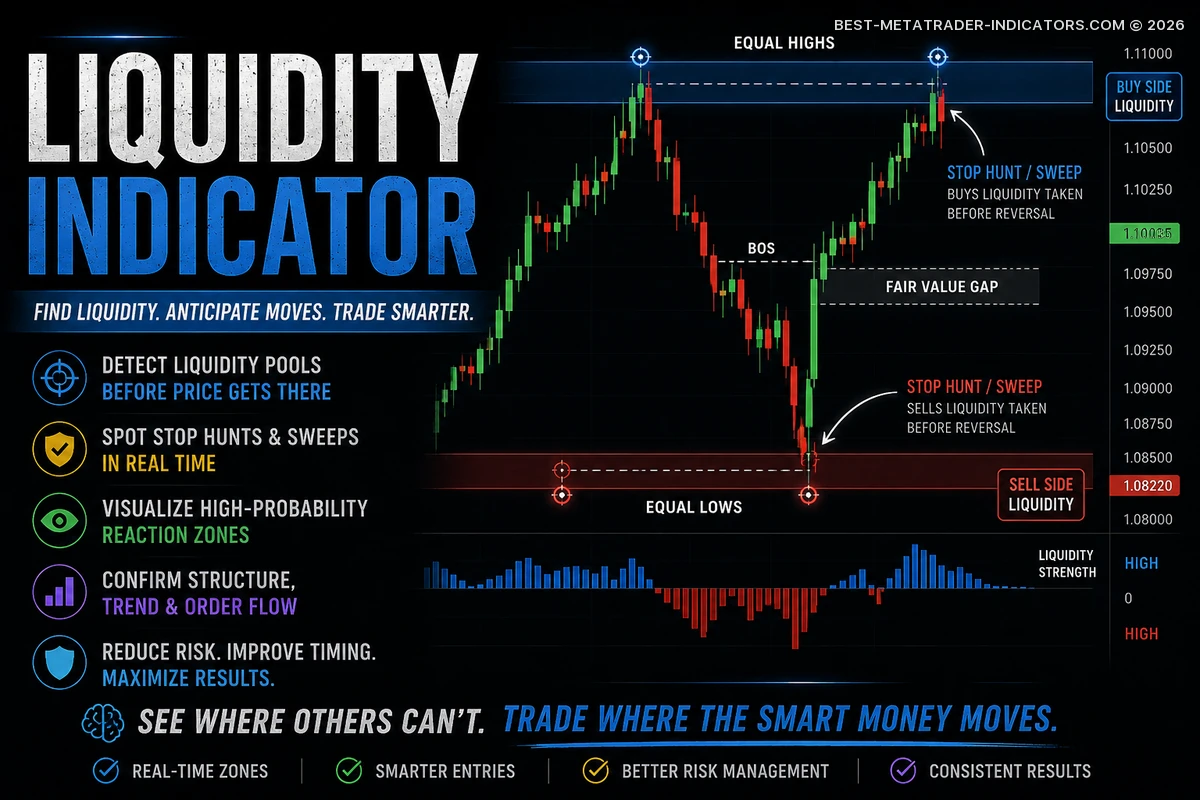
In Forex trading, liquidity often rests above old highs, below old lows, around equal highs and lows, near session extremes, and close to obvious support and resistance areas. When price suddenly spikes into those areas and rejects, traders often call it a liquidity grab, stop hunt, or sweep.

This guide explains how liquidity indicators work, how traders use them, what signals deserve attention, and how to build smarter trading strategies around liquidity zones without blindly chasing every spike.

Volume Profile Indicator Trading Guide for Forex and Gold

Forex Volume Profile setup highlighting hidden liquidity zones and institutional trading activity
The market leaves footprints — but only a few traders know where to look

The Volume Profile Indicator is one of the most useful tools a Forex trader can bring to a chart when the goal is to understand where real trading interest has built up. A standard volume indicator shows activity across time. Volume Profile shows activity at price. That difference changes the way you read a market.

After more than two decades of watching currency pairs move through quiet ranges, aggressive breakouts, failed retests, and messy reversals, I have learned that price alone rarely tells the whole story. A candle tells you where price opened, closed, and travelled. Volume Profile helps you judge where the market accepted price, where liquidity collected, and where price may react again when it comes back.